US 2021
How OpenTelemetry Improves Observability and Monitoring
The CNCF project OpenTelemetry is increasingly becoming the standard for getting the reliable and consistent application and machine data to your monitoring and observability tools. Many organizations realize the power of decoupling their metric, log and trace data collection from their monitoring stack, giving them more freedom and capabilities to improve the observability of their application. Organizations today want to discover applications issues quickly and have more confidence in supporting their applications.
In this session, learn about:
1) What is OpenTelemetry
2) What is the architecture of the OpenTelemetry Collector (OTel)
3) How do you build a strategy around OpenTelemetry
4) How do you get started with OTel
Standardizing on OpenTelemetry makes your application more observable and helps your organization implement better observability and monitoring practices.
Learn the why, what & how for OpenTelemetry, a new observability standard for app & machine data.
This session is presented by Splunk.
JC
Johnathan Campos
Senior Product Marketing Manager - Observability, Splunk
Transcript
Hi everyone. My name is Jonathan tempos. I'm a senior product marketing manager at Splunk. I've been in the industry for about 15 years, and I'm very excited to be here at the DevOps enterprise summit. We're going to talk today about making applications observable with open telemetry let's get started. So when it comes to making applications of servable with open telemetry, you want to first understand why we want to make these obligations observable. It happens to be with the new architectures that we are leveraging today with our deployments. Historically, we've always started with a monolithic architecture where these applications were deployed in a specific client server type deployment. And we were, we found them to be very slow moving with, uh, infrequent changes and limited user transactions. Things were kind of housed in one place, not necessarily distributed. When we looked at a microservice architecture and we evolved to a microservice architecture, we found that we had much more distributed services tends to tend to one, a hundred different services across many different hosts across different clouds.
With high transaction volumes and frequent code pushes across our CICB pipeline. Things became almost, or things are a bit overwhelming when it comes to microservices architectures. And let me give you an example, when it comes to monitoring, we can see in the left, we have an example of the different microservices that put together on the right this online boutique. And it's a very simple online boutique where we can purchase several items and you can see all of the different microservices that are involved from the front end service to the checkout service, to the payment service currency service, and more each one of these particular microservices are compared communicating between one another. And we have very high D high transaction rates that occur between each and every one of these microservices. So if we factor in, if we may have an issue with respect to one of these services, where is this issue located?
Where can we find this issue? We're not necessarily clear on where we could find this issue. So this is where observability can really help with respect to helping us find that needle in the haystack. This is why I cannot stress enough. That latency is absolutely the new downtime. Absolutely. The new downtime we find ourselves consistently dealing with Isolaz for customer experience, making sure that we consider this as top of mind, and this is exactly why I, again, I can't stress it enough. That latency happens to be the new downtime. It's not our CPU being pegged. It's not memory pegs. It is latency. So this is exactly why monitoring must evolve into observability. And observability really helps detect, investigate, and resolve the unknowns of the unknowns quickly and efficiently. When we monitor, we're just reactively, keeping an eye on things, seeing if something goes wrong, a server went down, a service went down, but with observability, you really can understand what happened and why.
And it's because we have visibility into each and every one of these transactions and each and every one of these microservices. And we're going to talk about how we do that with open telemetry today. So the first step in making your application observable is all about telemetry. We have to gather the data. The data is the key to understanding exactly what's going on. So how did we do that? Well, first we're going to build a strategy. We have to think about our application and we have to think about our application in detail factor, how many microservices we have factor in what we want to, what we want to monitor, what we want to see happening with these applications. And then of course, factor in the information that we want to highlight. And this is where instrumentation comes in. We instrument our applications. We instrument our applications to capture traces and spans and metrics to really see exactly what's going on. And then third is configuring our observability backend so that we can build the dashboards and we can build the charts that we need to clearly see exactly what's going on for our organization to maintain their SLS.
So now let's take a look at some terminology with observability. We look at it as the measure of how well internal states of a system can be inferred from knowledge of its external outputs. This is everything and anything that happens within our outputs of the different systems that we're using, or the microservices that we're using. And some of the data sources that we're going to collect involved, traces, which track the process of a single request metrics, which are a measurement about a service captured at a given runtime. And then of course the logs which are produced when, of course, certain blocks of code are executed. Again, all of this data is important and I definitely invite you guys to check out our glossary with respect to open telemetry on all of the different terms that are used throughout the open telemetry community.
So when it comes to Tracy, we have to first think about the context that we'll use. Typically we'll find that W3C tracing context is what's used, and this is going to be the format for propagating distributed tracing contexts between these given services. And the tracer comes in and it's actually responsible for creating and interacting with the context. And the spends are the unit of work that contains a name, but given action, of course, a start time and an end time. And they'll typically contain the kind which is either the client or the server or the producer, the consumer. And then of course, any attributes like the version number or any type of metadata that we want to include. And then of course the given event and any helpful links to really batch the operations. We're going to see that, uh, when we look at a configuration example here in a minute, and then of course we have the sampler and the settler is when we want to leverage that sampler, when not all requests in a given application, uh, are really needed to be captured. You want to balance observability and expenses. And then we also have the span processor, which is responsible for forwarding. These spends to the Xsporter and that exporter being potentially the old TLP export under the Jaeger Xsporter Prometheus's Splunk, observability cloud, any one of these exporters'.
So when it comes to metrics, there's a couple points, five points in particular to consider the context, which is the span of the correlation, the meter, which is used to record a given measurement, the raw measurement, which includes the measurement name, description, the unit of value. And we think about like CPU, CPU, utilization, memory utilization. When we go into the measurement, which is a single value of a measure. And then of course the metric is where we actually identify that given counter, which would be of course, the CPU or the memory and so on and so forth. Or in some cases we'll leverage an observer. And then of course, the time, the time where we're going to capture this particular metric. So what frameworks can help with making your applications observable open telemetry is definitely one. It's a CNCF OSS project with, with a strong community and an implementation of a collector and an agent made available to collect all of this telemetry data.
And it actually is becoming the new standard for observability. It really helps with respect to keeping all of our observability data, vendor neutral and building the standard that we can all use, no matter which particular language we're developing our applications with. And some of the open telemetry con components include a specification for your given language and API SDK, uh, instrumentation libraries also for your given platform, uh, which would be a single library per language for all your given signals. And then of course, a collector which receives and processes all of your telemetry data and exports that data to a given end of your choice.
And again, I can't stress enough. Everyone is contributing and adopting open telemetry. It's quickly becoming the new standard for observability and there. And we see cloud providers making it available, several vendors and users, as well as different other third-party entities. And you can check out the two links below to actually check to actually see the different adopters and the different contributors for open telemetry. I highly recommended. So we have to say why the adoption well, it's simple. The first and foremost, we're going to offload the responsibility from the application. That simply means that compression encryption, the tagging reduction of vendors, uh, vendor specific exporting, uh, control flow of data, all of this is considered, and this is why we see a lot of adoption. But the biggest reason is of course, the time to bottom it's language agnostic, which makes changes easier, kind of set it and forget it, and instrumentation is ready for the collector.
And the biggest reason is, is that it's vendor agnostic. You're going to instrument your application one time with open telemetry and it's vendor agnostic. So it makes it very easily extensible. Think about that time to value. So let's take a look at the reference architecture when it comes to the reference architecture, you can see that we have two different types of deployments, one on the left, and one on the right, the one on the left allows us to see that we have an application deployed, whether it's in Kubernetes, whether it's on a given, uh, bare metal host, this application is using the open telemetry library and it's sending telemetry data to the collector. The collector is then sending the information directly to a backend on the right hand side, we see the same approach except the collector is sending all of the telemetry data to an old Tel collector service. Also known as a gateway where we typically find these collector service deployments in a data center or in a given region or in a given ability availability zone, depending on your type of deployment.
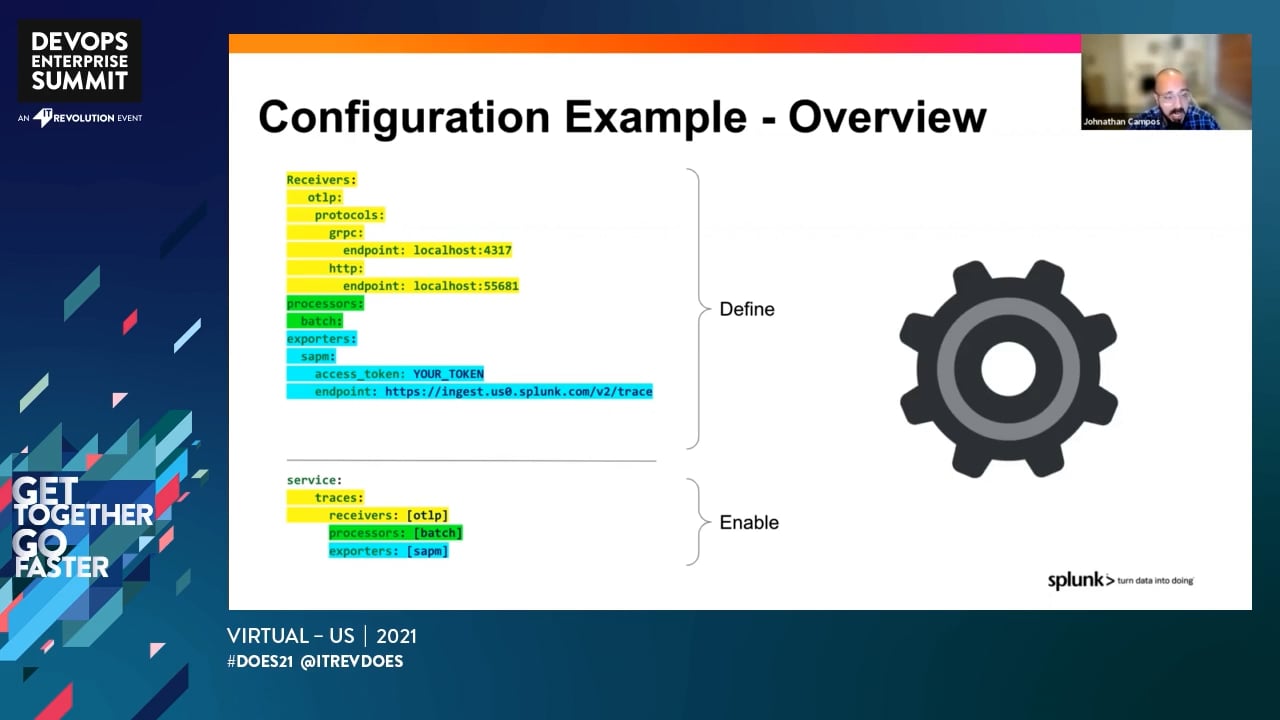
Now, the open telemetry collector is a vendor-agnostic implementation on how we receive and process and export telemetric data in a seamless way with a single binary. We leverage, we leverage a single library rather that can be deployed as an agent or as a gateway, as we saw in the previous slide. And we leverage this collector as the default destination for open telemetry client library data. Let's take a look at some of the details behind the Alltel collector configuration. When we configured the open telemetry, we must first define the given component and then enable that given component. And what are we defining and what are we enabling the receivers, the processors, the exporters', and be given extensions. Now let's be clear on what each of these are. You can see here on the left-hand side, we have OT LP set up as a receiver and a receiver is how you get data in and it can be push or pull based.
We can see here in the example that we're using OT LP to receive data from a given instrumented application, and we'll leverage the processor to do something with this data, whether we batch the data, the metadata, or we add metadata or redact data, say like a given social security number, we would then use processors to do that. And then of course our Xsporter to export that data so that we can get the data out and view and understand what's exactly happening with our application. And this entire process is what we create is how we create a pipeline. We'll define these given components, receivers, processors, exporters, and extensions, and then of course enabled them. And let me not forget extensions, extensions are things that you do in the collector, typically outside of processing data, what does this mean? Say like you want to have a health check of the collector. You would use that you would use an extension.
Now let's take a look at a configuration example. You can see in yellow, we've defined the receiver in green. We found the processor and in blue we've found the expert, the receiver using the TLP, using specific protocols, sending to a given endpoint, the processor is set to batch and the Xsporter leveraging the given access token and endpoint. And on the bottom, we can easily see how we've enabled them by specifying the given receiver processor. And Xsporter that we want to use. All of this is done using Yammer. Let's take a look at a quick example here where we've identified a given processor and this processor's action is to delete any type of QI or any metadata containing SSN. And it remove that information from the given trace. In this case, we can see that we've enabled that given attribute here on the top, we've found the given attribute and below we've emphasized that given processor attributes so that we can then take action on any key that has SSN, same exact thing occurs when it comes to any key that occurs with user we'll go ahead and apply a hash to that given metadata so that when we look at this information on our backend system, we'll clearly see that no social security information has been applied to
And the system. So to better understand the open telemetry configuration, what I'd like to do is demonstrate how we would use processors to omit or redact a given social security number from an end-user sent to a backend service using processors. And with that, what we're going to do is we're going to first take a look at the configuration that does not have the attributes processor enabled. You can see, we have a definition for receivers where we're sending, uh, we're sending, uh, all, all information to Zipkin on port 9, 4 1, 1 we're exporting to logs. We're not doing anything special, sending anything to any backend service at this point, just for the demonstration. And then we've, again, we have a definition here for a given processor so that we can remove the social security number from any payload that may be sent to the backend service here on the bottom.
We've enabled only the receiver Zipkin and only the export logging on the second configuration. We've then enabled that processor attributes, which we can see here. And this is the processor attributes, and this is what the payload looks like. You can see that we have a trace ID. We have a parent ID. Uh, we have a kind where S where we're identifying the name, uh, the timestamp, the service name and so on. And then as far as the tags are concerned within this given trace, you can see that one of them happens to be a social security number. The other happens to be an email of that given user status code, the method and so on. So to get started, what we're going to first do is we're going to start taking a look at those logs.
We can see here that the collectors ready, uh, begin running and processing data. So that looks good. We'll then go ahead and replace the agent config file so that we can reflect the configuration that contains no processor attribute again, that's this one right here. No processor attributes. So now that we've done that, we'll go ahead and restart the collector, and we can see that reflected here in the logs, everything is ready, begin running and processing data we'll then go ahead and send the post. And we can see that the backend or in this case, we've stored in the logs, the actual social security number here. So the user, the user email, uh, the ACP target and so on and so forth. So everything here is reflected and collected on this given backend service, which in this case is just a logger we'll. Then go ahead and replace that configuration file. So the one that reflects the actual processor or enables the processor attributes, which we can see here, and we've done that, we'll restart the collector again, and then we'll run that post once again and see that the actual user's social security number has been redacted.
So again, this is exactly how we can use the configuration of the open telemetry collector to leverage processors, to redact metadata from given payloads that are sent and stored, as far as traces are concerned.
Now, what about instrumentation? Well, we want to instrument our applications. We first want to instantiate a choice. We want to create spans, and we want to enhance those spans and then configure our STK. That's for traced, for metrics. We want to instantiate a meter, create metrics, enhance those metrics. And then of course, configure an observer. Let's take a look at some examples here. So let's take a look at an example. When we automatically instrument an application. In this case, we're looking at Java. You can see here in yellow, that we've emphasized Java, where we're executing this application called my app dot jar for an example, and we've emphasized Java agent and a path to the open telemetry library and some specific information that we want to pass over, or you want the library to use rather. So for example, where to send the information or the telemetry on local host, port 5, 5, 6, 8, 0, and what service this particular application is associated with, let's say, this is the shopping microservice.
As a given example. Now instrument auto instrumenting. Your application is very, very beneficial. Why? Because you leverage this library with absolutely no code changes and it's configurable via an environment and runtime variables. And these are these runtime variables that we're using. Now. One thing to emphasize is that all you're doing is really just updating your runtime command for your given application. And now your application is instrumented. So it can co-exist with manual instrumentation, if need be manual instrumentation requires code changes, where we instantiate that tracer. And you can see that example here above. We would then create the span, which you can see here, name that span, specify when the span will end. And then of course, enhance that span with specific metadata or certain attributes, rather that we would use to identify what's going on for a given version or for, for a given action.
Now, when it comes to metrics, we can see here instantiating, the meter, leveraging the given library name or library that we're going to use rather. And then of course, emphasizing that we're going to gather metrics on CPU usage. So manual instrumentation does require a bit of code change, but we add this information to again, understand exactly what our application is doing. And this is where observability comes to life, really understanding what each and every one of these microservices are doing. So with that, I thank you for joining today's presentation. And I did provide you guys with a couple of links to help you guys get started with respect to open telemetry and, uh, check out a few demos that we have. We have the CNCF demo. Uh, we have a tags webinar, which I think would be great. This will allow you to really add that the data that you need to really understand your traces. We also have a great blog post that you can read on open telemetry, as well as a Gitter page, where you can have fun with open telemetry. With that being said, my name is Jonathan capitals. Thank you so much for watching and have a great day.