Las Vegas 2022
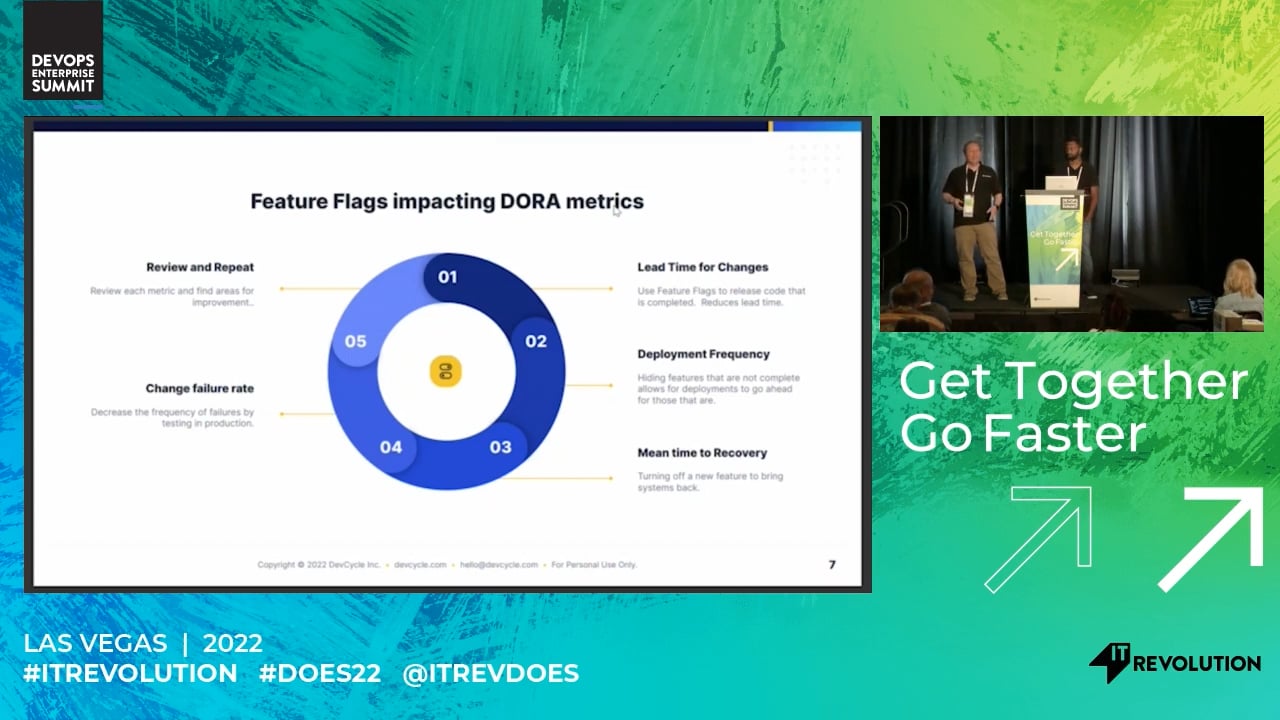
Connecting Feature Flags and DORA Metrics
How Royal Bank of Canada measured the impact of Feature Flags on their development performance using DORA metrics.
Measuring the success and impact of new development processes is crucial to ensuring your team is always well-equipped with tools and processes that actually drive growth. Any team looking to adopt feature flags in their workflow should also adopt a way to properly measure the success and effectiveness of feature flags. DORA metrics, specifically Deployment Frequency and Mean Time to Recovery, are two criteria that engineering managers and team leads can use to both motivate their team members to use feature flags, and provide rationale to their organizations on why feature flags are effective.
Even for teams not yet using DORA metrics, evaluating your processes using these two criteria are a great way to get started with them. Deployment Frequency is easy to automate and measure as it is easily added to the CI/CD pipeline tracking when new releases to production are completed. Mean Time to Recovery can be calculated from issues in the support management system that are tagged as a production outage.
RBC’s implementation of feature flags and their use of DORA metrics to measure the success of feature flags is a prime example of this. As part of the process of adopting Feature Flags the Digital Investing Development team wanted to be able to measure the effectiveness of them. The team has been implementing Dora metrics and this seemed like the right place to start with understanding the impact Feature Flags would have on their software development performance.
MA
Mark Allen
Feature Flag Evangelist, Devcycle
NS
Niroshan Shanmugarajan
Director of Development for RBC Digital Investment, RBC