Nationwide Building Society: Measure for Learning

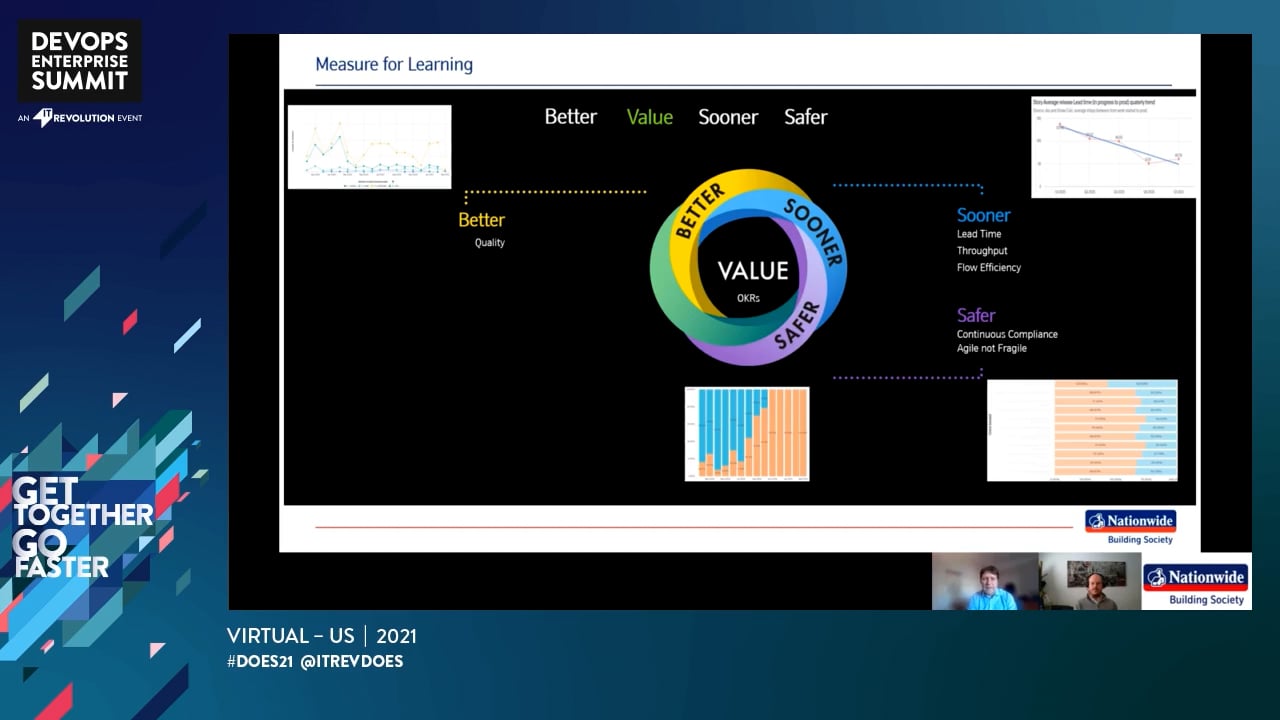
Join us to learn about how Nationwide Building Society are empowering colleagues at all level with access to data, metrics and insights which support a culture of data-led decision making, continuous improvement, and learning. We will share with you the journey of how we unlocked measurability of Better (quality) Value Sooner (flow) Safer (compliance) Happier outcomes. What patterns and antipatterns we observed. How we set up and ran our experiments, engaged colleagues, built our self-serve dashboard product from scratch and reached an active customer base of 500+ colleagues at all level in just 12 months.


Our team was finalist for “Digital Transformation Project of the Year” at the UK IT awards 2020 and the product was described by Nationwide’s COO as the ‘best example of a game changer’.

MP

Marc Price

Product Owner, Enterprise BVSSH, Nationwide Building Society

ZB

Zsolt Berend

Business Agility Coach, Nationwide Building Society

Transcript

00:00:12

Hi, everyone. Welcome to our session today. Um, we will be discussing a measure for learning that nationwide building society. Uh, if you cast your mind back to does Europe, uh, hopefully you would have seen, uh, a presentation from our colleagues, uh, Leon bridges and Mark Randall, where they discussed intelligent control, unable in safety at speed. Uh, uh, from that session, you would have noticed that, um, they provided a pin boards and they were one of our early adopters of the product that we were planning to show you today. So, um, a bit about myself, um, I'm Mark Price, uh, and I'm a product owner for our measurement and insight product here at nationwide building society within our, uh, data and analytics community. Um, w the main vision for our product is to enable colleagues have access to relevant data and metrics to support a culture of data enabled, uh, continuous learning improvement within our ways of working. Um, and yeah, it was all, uh, over to you.

00:01:10

Thank you, mark. Uh, I'm sure that, and I'm really happy to be here. Um, and business agility, coach and nation might be an in society, uh, specializing on data and insights, uh, working with mark, uh, and, uh, having the organization on the journey of becoming a learning organization, um, co author of sooner, safer, happier back to your mark.

00:01:40

So, yeah, what do we plan on covering today? So we're going to start with a little bit about our journey, how we've transitioned from a startup kind of ways of working to a more fully fledged product as to way the way that we work today. Uh, then I'm going to cover a couple of, um, observations that we've incurred over this time, uh, around how we transitioning from anti-patterns to patterns. Uh, hopefully we're going to give you a good demo of our product and show you some of the metrics that we've provided to all the end users, and then we're going to end with a voice of our customers. So you're not just going to hear from us today. You're actually going to hear from the users of our product, uh, and how they are using it within their context across nationwide building society. So with that, let's go on to, um, you know, give you a bit of an overview of our product.

00:02:31

So if you can cast your mind back now back to, um, you know, pre COVID times when we were all in the office, uh, around white boards, um, and w what we observed at nationwide was, um, we had a lot of manual reports, um, you know, off those whiteboards in their local context of each of their teams. Uh, and what we saw was, you know, they were measuring outputs. So how many tickets could we get done in a sprint, for example, um, and what we quickly decided as we come into the, the start of 2020 in Q1, uh, what we quickly found is that there's what we needed a product. Um, and at the time, um, we decided to partner with the sooner, safer, happier team. Um, but what was key to this was getting that, that leadership buy-in. So, uh, we worked together with our leaders within the ways of working team within our data analytics community, uh, and, um, we were given the opportunity to, to experiment, uh, find new data sets within the society.

00:03:32

And, um, you know, what we did is we, we tried some things out and, uh, what we would key on saying was nothing was a failure at this point, uh, because we learned from every experiment that we did, even if we didn't have the desired outcome. So what we did was we started to kind of bring together a small team within the society. We decided to build internally rather than using, uh, an off the sharp product. We wanted to use the capability that we already had. Uh, and then coming into Q2 of 2020, uh, what we started to do was, uh, we wanted to get our product out there and seen within the society. So we followed the sooner, safer, happier pattern of invite over inflect. So what we did as a central team, we started to run show and tells we've our we've users that we identified, uh, across the society that wanted to improve their ways of working.

00:04:26

And we really focused on those, those early adopters. So, like I mentioned before, um, with, you know, uh, does Europe, the, the team in talent control were really a key kind of early adopter of, of our product. Um, so, and then we started to invite them to show themselves, uh, and then instead of the central team providing the insight, it was actually those early adopters that started doing that for us. Um, so as we go into, into Q3 of 2020, what we started to see was we were really able to unlock the measurability of the flow of end to end work across the society. So, uh, one of the key decisions we made upfront was bringing in our delivery kind of information from, uh, JIRA at the time that we adopted together with our run organization that was using service now. Um, and what we did is we linked those two systems together to give a full end to end picture of flow flow of work, um, across the society.

00:05:25

And you can see there, the example of one of the charts that we produced early on, and you can see the trend there, that's really kind of, um, getting better over time. So we were able to reduce that end to end, uh, flow of work, lead time, uh, and then coming towards the end of 2020, uh, we really started to kind of see the, the adoption of, of our products, uh, kind of take off. And what we started to see was where we'd attracted the early adopters. Uh, we started to cross those cross the chasm, and really start to, uh, bring in the early majority and the late majority into using our tooling. Uh, and that was kept with us becoming a finalist at the UT, uh, UK it awards, which was which really good, and some recognition, you know, boost the morale. And we could see that the tool was becoming used and fundamental, uh, within the society.

00:06:18

Um, and now coming up to the start of, uh, 20, 21 in Q1, um, what we really decided to do now was really target, um, the C-suite with, with extra insight. Um, so we created our, our CIO scorecard, um, and instead of kind of just putting metrics on, uh, on, uh, on matrix, we decided to use, uh, case studies at this point. So we would partner with the early adopters and users across the society that have adopted our product and come up with those kinds of great messages of how the data and the insight has improved their ways of working. Um, and that really got the kind of C-suite excited. Um, and they wanted to kind of adopt this, uh, themselves and started to, uh, access the data, uh, directly and self-serve, and now coming up to the present day. So we're coming up to Q2 of 20, 21.

00:07:12

Uh, it's been a great journey and you can see that the adoption of our tool and really has kind of taken off. So we now have over 900 users at all levels of, of the society accessing our data on a day-to-day basis. Um, but what's great to see is that we we're actually seeing our end users now create content themselves. Um, so they're creating their own insight boards, uh, on the flow of work, uh, quality, and then the alignment to the golden Fred, which, which we'll cover later on in this presentation. And hopefully we can give you some examples of that. So, uh, as you can see, a lot can change in a year to year and a half, um, and it's been an incredible journey. Uh, and one we're not at the end of, so we have big plans for our product and we continue to add new features, uh, remove technical debt, uh, and continue with our product.

00:07:59

So, um, yeah, let's go on to, um, someone kind of patterns and anti-patterns that we've observed during our time, uh, on this project so far. So, you know, we're not, like I said, we're not at the end of our journey. We can see we're moving from anti-patterns to pattern. So what we wanted to reduce was the measuring of outputs. So how many stories are being completed in a particular sprint or how many features have been delivered to measuring the outcomes of that? Okay. So what's the value that's been delivered as part of those, uh, of those deliveries, you know, adopting the better values to, in a safer, happier, um, uh, concept as well. So, uh, the next one is, um, all about, um, you know, reducing that kind of centralized and often manual reports, like, like I said, at the start of our journey where you're kind of siloed within your, within your team, we wanted to reduce that and offer that self-service discoverability of, of data.

00:08:58

Um, so that users can start to, you know, interrogate the metrics themselves, create their own insights and share that within their own context. And as you saw on the last slide, we're definitely starting to see that take off of the society. Uh, the next one weaponized metrics, no one wants to weaponize, um, or feel that metrics have been being used to weaponize. So, uh, one of the key kind of concepts that we've always pushed at the start of the product was, um, this isn't about comparing one team with another. This is all about local context, uh, and, and enabling that, that measure for learning, focusing on maximizing the outcomes and that, you know, that key learning that then you go and share with that other team. So instead of comparing yourself to them, you're actually learning from them, um, which is, which is great to see.

00:09:47

Uh, and then the final one, um, you know, what we wanted to do is remove kind of disconnected data sets. We wanted to kind of create a, a single truth of data, uh, that, that all can use that we were starting to see that unlocked measurability of flow quality and value. So, uh, yeah, it's been an incredible journey and these are some examples of some of the patterns that we're moving to on our journey. So with that, I'm going to pass over to Zola. That's going to take you through some of the metrics that we've been delivering.

00:10:18

Thank you so much, mark. So the first dimension, the provide service on is around quality is that on better service, a better product and better product quality. Um, and these are mainly production quality metrics around incidents in production, uh, in type Dory store, uh, change failure rate, um, and others. So it's all about the quality of our product, the value, which is, which is in the heart of, uh, why we out in business is bespoke to the products, uh, within the society. And it is measured through objectives and kitties, uh, which we got gonna hear a little bit more from our, um, Rhodiola session office team in the voice of customer section, what we provide, uh, for them as a measurement and metrics is around the alignment. So how the team, what the work that the team is working on is aligned or not aligned to the strategy.

00:11:17

So this is about whether it's high alignment or low alignment, the percentage of the percentage of stories aligned to the top of the strategy that the post-it portfolio that comes then, uh, we have sooner, which is all about flow or about end to end flow visibility of flow, um, understanding how long it takes when work starts. We have the committed, uh, so how long it takes, uh, to get out of the hands of the customer at their production. Um, and, and also about flow efficiency, which is, um, the time, uh, work is in working. So the, the time, um, a third versus divided by the Anto and the lapse time, uh, which is usually a large at large organization is quite low and less than 10%. Uh, so this is a good information, and we have been on the journey to unlocking measure the ability of flow, uh, and to, and flow.

00:12:17

So to be able to see, uh, impediments cues and also flow efficiency and to add, so the chart on the right you see is about a really positive trend, uh, that, uh, the time is half for eight particular, uh, very slim, um, Dan safer. So this is about not only speed, but also, uh, control, speed and control. So this is about continuous compliance, uh, and there's marks on the, for very early adopters where the intelligent control team started using our dashboard, uh, to show risk, um, and, uh, across the society control is high. It's been mitigated and, uh, and then compliance, um, and then happier. So this is about colleague happiness, which is the heart of, of what we do is raise a fair game. Uh, if colleagues are happier than the customer is going to be happier. So there is a direct positive correlation, uh, between, uh, chronic happiness, um, customer happiness.

00:13:22

And this is, um, also on the point that these are not, uh, measures, uh, in isolation. So none of these should be measured at the expense of the others. So as in the state of DevOps reports, we see that, um, so that if Dean's, uh, uh, mediocre performance, which is only looking at, uh, sooner, so only looking at getting, uh, uh, new features out at a much faster pace than it is going to be at the expense of quality. So the quality gonna go down and also, uh, chronic happiness kind of product kind of go down. So these should be considered as a balanced measure because it's all intertwined and, uh, should be measured all of them and not just one in isolation. Thank you. And now we can assure you our product. So we gotta be, uh, doing a little bit of a demo of our different services we provide,

00:14:25

Thanks for that salt. Uh, and what we're going to do now is give you a brief demo of some of the metrics that we'd be creating as part of the product. So, uh, as mentioned in the better value, sensitive, happier slide around the different metrics that we've been providing, this is all around the value. So, uh, what we've enabled the team to do is using the chart on the, on the left-hand side here is how, how many stories that are being created by that team link, that golden thread. Now, the golden thread for us is, um, Lincoln stories that have been created in JIRA right up to the top of the portfolio, around the outcomes that are being delivered and, and the strategy that the society is looking to implement. Um, uh, and what you can see here is the team adopted year around 20, January, 2020.

00:15:12

Uh, and what you can see is, you know, at that time, they were able to link in around 25% of their stories into the golden thread. Uh, and as you can see, as time goes along, uh, they've started to adopt new ways of working, and they've been able to achieve around 80 to 70%, uh, of this stories Lincoln into that golden thread. And you can see in September, as we're halfway through, uh, around 45% of their stories are actually linking into that, into that golden thread. Now, why, why is this important? Well, we want the team that actually doing the work on the, on the ditch, the basis to see the impact of the work that they're doing as for the society. So that worked Lincoln right up to the strategy and those key outcomes that we're looking to achieve now. And then on the right-hand side, uh, we have a, a measure as a, as, as a combination of, um, work that's being delivered.

00:16:07

So this team has been able to link in seventy-five percent of their work right through to the golden thread since they started adopting new ways of working. And why is that important again? Um, we've partnered with our, uh, value realization office to say, uh, to really govern this metric in the society. Um, we would like teams to be able to link in at least 80% of their stories, uh, and the work that's being done within that team into the golden thread, uh, to help with the value realization that, that we are trying to achieve, uh, within the society. Uh, and then the last chart in this case, uh, the top down. So what this is showing is that, um, the percentage of objectives, so that you have to, that the society is looking to achieve, or this team is looking to achieve. Um, and what percentage of those have at least one story LinkedIn to them? So we don't want any orphan objectives that we might have a planned due dates and no work has been done on them. So we just wanted to give you a quick overview of that. And now, uh, I'm going to pass back to Zoe. Who's going to give you a brief overview of some of the other, um, insights that we've created as a product.

00:17:16

Thank you so much, Mac. Um, this is another board. This is not a services, and this is a concern with flow. We talked about this as a relevant dimension, so flow end to end flow, uh, how long it takes the committed to the delivered into production in the hands of the customer. The top of the work is either the reflection of the Antwan, uh, flow of the mapping or another voice, the bodies, the mapping for the paprika themes, uh, and then the different differentiate as you see, blue and Amber, uh, bars, we differentiate, uh, V8. Uh, so tickets invading, uh, versus, uh, tickets, uh, being worked on. And what you'll see on the bars is the actual average time spent for tickets in this particle states. So the cycle time per state, and this is popular because teams are using it to drill down and to identify impediments, to flow and hard to overcome flow.

00:18:20

So they are looking at whether, for example, that the, for development, uh, is it, is it a big queue or the, for deployment, or are we spending, uh, tickets are spending too much time, they blocked on hoard. So, um, driving discussion, what are the impediments and how can they collaborate more? How can we shift collapsed? How can they reduce lead time equally if Ana is, is, uh, is at the time in, and that is, is, is, is big. That will drive conversation around whether we are doing a big upfront analysis. I'm not working, um, uh, together with the developers, um, on what, what we have in and move stuff to them before we start something new. And then the Devon at the bottom is at our distribution distribution of flow, so that the different type of works and how much focus we have on technical debt, for example, uh, whether VR little feature development, uh, as, as a digital fact feature factory, or we have enough focus on technical excellence and the distribution over time that if you have a balanced backlog or not about as backlog, again, teams are using it to track conversations, um, whether they have a half backlog, the next board is that aren't key metrics, uh, in DevOps, which was defined by the state of dev ops simple what's published in the, uh, the study in the data's book, accelerate, which is around main, main key, key metrics around it is lead time.

00:19:59

We talked about lead time having various starts, uh, on the production. And then we see here a good trend, uh, the themes, they start to get themes half the lead time from Vogue started to production, so that I'm lead time, change failure at it. What there's the success or failure rate in terms of production? It is this, uh, mean time to recover, uh, is at, um, how long it takes to recover from an incident based on different priorities, the number of hours it takes to recover, and that deployment frequency, uh, which is really important for us is the percentage of, uh, applications that it is in into production. Particularly we are looking at, uh, the person at the shelf applications having at least one that is into production once a month. Uh, and that, that it's a positive tram. So that more application Saturday, these in more frequently, this is not a comprehensive overview of the different charts, but just wanted to give you this there at arm, uh, the different dimensions of the different metrics that we are providing to colleagues at each level at the society and the dad, I would like to invite our customers, uh, to tell us what they think about our product.

00:21:23

I mean, I can lean portfolio management team and a fundamental for us is to be clear on how every piece of work contributes towards the society strategy, making sure that teams are really aware of the true value of their work, helping them prioritize and focus on the right outcomes. ThoughtSpot has really unlocked this ability for us. It gives us an overview of where teams have, or haven't aligned their work to the strategy in JIRA. It lets them drill down to identify which pieces of work haven't been aligned, and they can quickly correct these. One of the really key things that makes it work for us is the BB SSH team itself is cause they're always ready to make fast improvements or give support where needed

00:22:09

Hi, I'm Mel I'm part of the team helping to build and enable intelligent control as a way of working. So intelligent control is a collaborative approach that ensures for the work that we do. We understand our risk as early as possible. And we embed the right control capabilities at the right time. And my focus has been on providing improved visibility and traceability of our controls position, increasing the confidence for our end users across the society. That risks are being mitigated appropriately. And this is all about measuring what matters. And we've been using ThoughtSpot to enable this with data from JIRA and service. Now feeding into ThoughtSpot, we've been able to create interactive pinballs, creating data and insight from multiple sets of data visualized in one place. And by having this controls data in those bots, we can more easily and quickly identify impediments to flow whilst the controls are being implemented. And while by there are releases, our customers can filter the data for release and check the status of controls prior to that release being approved, which will speed up and he'd go, no go decisions. And within just a click of a button, we have the ability to more easily drill down on the data and link back to the source data, which allows us to explore the data further for better informed decisions. And of course it means that we have that audit trail all the way back to the source data to

00:23:34

Hello. My name is Craig. I work in payments and I help our teams improve how they work, where our teams are to achieving regular production deployments, where we encouraged to measure how work flows with the team. So specifically, how long does it take for work to go from in progress to production, how they're actually increasing the amount of time on average, how long it takes to go from in progress to production. And they've been achieving this by making ongoing improvements and reducing batch sizes.

00:24:08

Well, that was great hearing from our customers and how they're implementing our products within the society. Uh, you're going to hear some final thoughts from our leaders across the society, uh, myself and Zoe, we're going to remain in the chat, but we'd really like you to stick around and hear those final thoughts. Um, we wish you all the best and enjoying the rest of us. Thank you.

00:24:30

Thank you.

00:24:40

It's what you, James was working even the here at nationwide. And that just wanted to take a minute to give a perspective from myself on the importance and the impact of measurement insight here. What I've observed is that actually the team itself are acting as an exemplar, an exemplar for a lean startup product development approach. They have found excellent product market fit. They have well and truly cross the chasm and they are now using kind of viral engine growth to really kind of maximize that sense of, of impact here for our colleagues as customers. Now, importantly, from my perspective, the proposition they're selling is also supporting itself our business agility agenda. Um, if I look at the golden thread initiative, really sort of seeking to support that high alignment, deriving high autonomy for teams, and then the dashboards that also support a better appreciation of flow, a better appreciation of the kind of coolest or relationship across better value, sooner, safer, happier. I couldn't be more proud of both the work the team have done to create the dashboards as well as the quite profound impact these dashboards are having on providing measures and insight for teams to improve in their context, across the society, chapeau to the team, you are amazing

00:26:03

In a large organization. It can often be difficult for people to really understand how the work they do every day relates to a bigger, more strategic objectives. So we're on a journey of nationwide to help colleagues understand how they can better prioritize their work, focus on value and improve flow right across the society, all for the benefit of our members. And we call this our golden thread initiative. We've already seen that using the relatively simple metaphor of a golden thread is brought to life for our people. The importance of making sure that their work is visibly aligned to our strategy to ensure that what they do every day makes a difference, not just to the organization, but to our 15 million members, but you don't need to take my word for it. You've heard in this short presentation that we have the data to prove it.

00:26:57

It's great to hear our people talk about how they found having greater access to measurement and insight so powerful. And the benefits it's brought in terms of making work visible and measuring progress as a mutual, making sure that we are focusing on the right things for our members is at the heart of our purpose. And this has been a real game changer for us here at nationwide. Being able to clearly see information on release frequency end lead times, wait times and production quality is, is helping strengthen relationships right across the business dev and ops teams. It's already helped our understanding of how we can better connect, work to value and continuously improve the quality and pace. And on top of that for teams to be able to clearly measure and track their work against her objectives has been quite empowering.