Trials and Tribulations of a DevOps Transformation in a Large Company

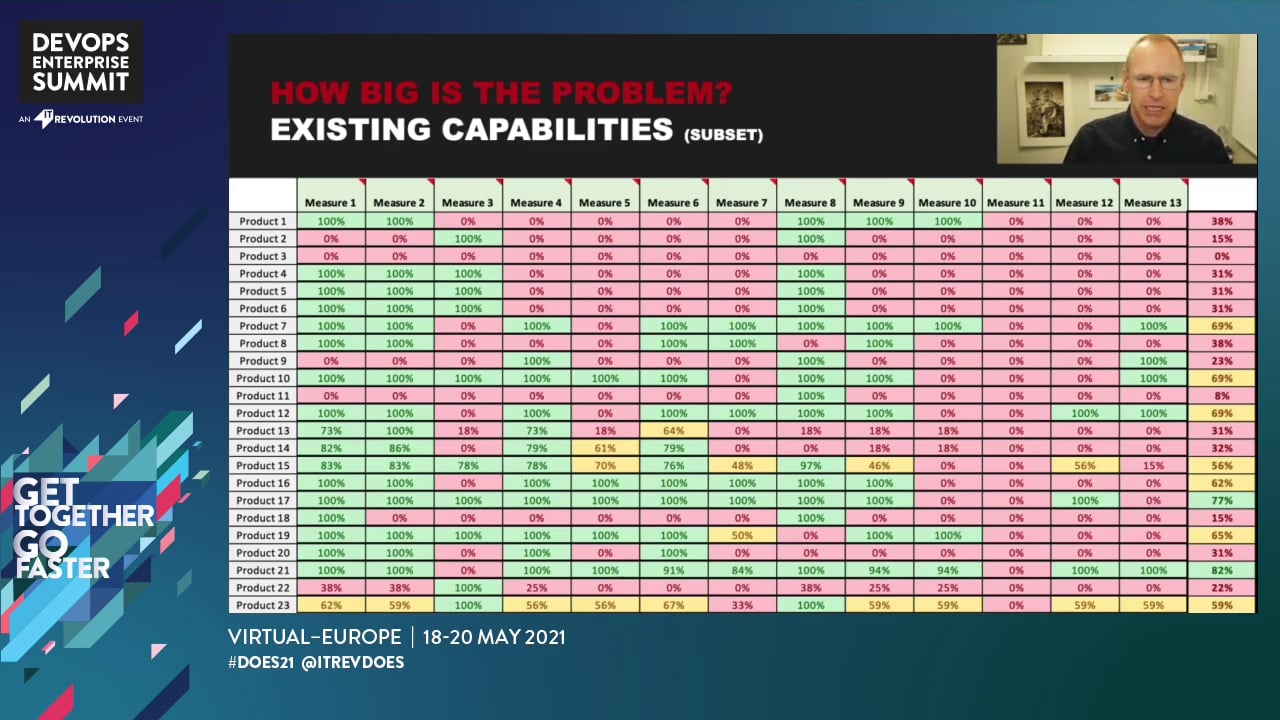
Every organisation faces different problems when transitioning to a DevOps focused culture and large organisations can present more challenges than most. In this case study, I’ll share our experiences of how we put DevOps Theory into practice in a 3500-developer organisation; what worked for us, what didn’t work and the areas we are still working on 2.5 years into the transformation.


Through automation, we standardised CICD pipeline creation, which saved each team weeks of effort per pipeline. Automation enabled teams to take full advantage of the built in DevOps capabilities such as Shift Left on Security and Continuous Integration. Extending the automation into custom dashboards enabled teams to visualise their progress towards Continuous Delivery and take action where appropriate.

AN

Ashley Noble

Engineering Fellow, Honeywell

Transcript

00:00:13

Hello. My name is Ash, a chief architect for DevSecOps and Honeywell connected enterprise. Today, we'll be telling you about our transformation journey to a DevOps culture. Honeywell connected enterprise is a relatively new organization created to dominate the industrial IOT market, bringing together the common parts of several diverse verticals, such as connected arrow, connected, industrial connected building, connected cyber, and several other divisions. Honeywell is a large company. We have around 10,000 software developers of those about a thousand are in the connected enterprise. The mission that we're given relatively simple as to bring DevOps to the organization. We were fortunate enough that when we started this two and a half, three years ago, that book code accelerate was released. This really gave us a blueprint for how we could start the transformation to the DevOps culture. There were already several approaches in play for doing agile transformation in the company.

00:01:13

So we focused on the continuous delivery behavior and the enablers for that such as test automation shift left on security, continuous integration, et cetera, in order to map out where we needed to go, we need to understand what the problem was. So we researched a section of the pipeline. So we had 414 and found that we had 649 combinations of tools and processes within those 414 pipelines. We had some monolith which had the same job being taken off by several tools in the same pipeline. We found that we had a lot of commonality, but also a lot of variants. For example, our version control tools. Most teams were using Bitbucket. Three quarters of our teams were using bamboo. Under half of our teams were using our standard deploy tool, which was octopus deploy. We also found that even though sometimes we're using the proved tool that we're using their own instances of it, they'd stood it up for some reason of their own.

00:02:20

So we understood where the problem was in terms of tools. We also wanted to understand what the teams were facing with their capabilities. So we got all of the teams to fill in a survey around their pipelines, measuring 13 different capabilities, roughly aligned to the capabilities of continuous delivery on the left-hand side is approximately the build phases on the right-hand side is approximately the deployment phases and full automation of those capabilities in the middle is around automated testing, some of the security. So you can see that we had some, some we were doing really well. We had a lot of good automation, some great capabilities, other areas we weren't doing very well at all. And in some cases we had pockets of excellence, but they weren't spread out across the products. What we wanted to do was make sure that when someone created a new pipeline and released a product that I would grain across the board, all the measures were grained straight away without having to do any extra work in order to achieve this, we time out without three pillars, plan automation, enablement, and measurement.

00:03:35

We wanted to automate all the tools and processes to remove manual steps for CICD pipeline creation and execution. We wanted to measure the key indicators to identify the areas of improvement for the development teams and the coaches. And we wanted to guide the establishment of a DevOps culture aided by the automation informed by the measurements. So these three pillars all interact with each other. On the automation plan, we created a tool called automate and imaginative name. It was a self service CIC pipeline portal. In general, when you look at a pipeline at a high enough level, most teams, most people's pipelines look relatively similar. Our pipeline, basically we usually use a Atlassian stack and we deploy to mostly as your end points in the cloud. We also deploy to on-premise. We have a number of tools listed here, but these are just some of the major tools we have hundreds of tools used amongst the pipelines for different languages.

00:04:44

So this was the standard pipeline that we wanted to create in order to do that, we created the automate tool. The automate tool is used by a developer to create a CICB pipeline at CRCD pipeline uses a build farm that we supplied, which deploys to in general, the application hosting environment, which for us is Kubernetes. And it could also deploy to other issue or on prem environments as well. And we use the dev ops dashboards to visualize the CRCD pipelines and help teams improve and understand their current performance. The build farm and the application hosting was, was a real time-saver for teams because when they used to build pipelines themselves, they would have to create their own build agent that would then do the builds for them. And that usually only create one of those. And then they would also have to figure out how to deploy into a cloud environment environment by themselves.

00:05:44

So we provided those for them, which dramatically reduced the amount of effort they needed to spend. So we know we needed to create pipelines. When we analyzed all the different pipelines, we found that we had several categories of pipelines that were being put together to form an application. In general, we found an application was made up of a web UI, which was talking to some sort of web API, which had some sort of backend processes, which were processing messages, uh, or events that were flowing through the system. The UI had some sort of widgets that I would share amongst themselves. We also had backend libraries that would share code amongst the different backend services. So this is how we would generally build an application.

00:06:34

So if we were creating pipelines, we want it to be able to create a pipeline for each one of these categories or templates. So what would we considering as part of a template, our templates come with sample code. If it's a to-do application, our templates all come with sample code, and it's always the same example in the sample code. If, for example, it's a web API, then we would be the to-do application and there would be end points to hit, to create a to-do item, to delete it, to do items, to market, as checked, to edit a to-do item. We provide these examples in multiple languages and multiple different technologies, such as web API or web UI. Continuous integration is a major capability that we wanted to enable our teams. So we enabled feature toggling as part of the templates out of the box. We also included many different types of automated testing from unit testing, integration, testing, acceptance testing, which is tests running against the deployed instance.

00:07:43

We also had performance tests which were running against the deployed instances as well. And these would come out of the box, also included, was monitoring. So the ability to monitor the application and receive alerts when things weren't working, but also assess and analyze the performance over time, as well as code would include all the scripts for the different languages and different operating systems that developers were using. So windows, Linux, or Mac are all used throughout the organization. The scripts we'd provide with build scripts, packaging, scripts, deployment scripts, but also include all of the scripts to do the security tool integration alongside the scripts and built into the scripts would be our processes, our release management controls such as making sure that it wasn't possible to merge to master without having a code review or at least having it and having a successful build. It wasn't possible to commit code, which had a critical vulnerability. If a critical vulnerability is attempted to be merged, then the build will break and it became, the team must fix it before they can merge the code.

00:08:56

So that was the definition of a template. We've been building out templates for a while now in multiple different languages, from four different categories and templates. We have we're backed by web APIs in multiple languages, processes, libraries, we've got mobile development. You have some infrastructure, generic templates, a suite of data science templates. Recently we've been adding system tests, both performance and functional templates. And we also have a set of embedded templates. This is an example of a embedded device being developed on the automate system. This is the acceptance tests where when the build executes, it deploys the firmware onto the device and then runs a set of acceptance tests to indicate whether the, all of the features that have been added, continue to run as part of our build phase. We used the cake build system in order to standardize across all of our pipelines and make it easy for teams to move from one, one group to another group, not have to change different systems.

00:10:07

When they move. We used a build farm to parallelize out all the tasks needs to be run. I major concern of developers when we added all of the tools such as the security tools in shift lift was the length of time that the build would take. And this was a valid concern when they often only had one build machine and things ran in series. When we have a build farm of 40, 50, 60 machines, then they can just parallel laws out and be running in parallel and then come back together. When they've all succeeded for a build script, we have number of requirements. The main one was that it should have a minimum repository footprint, meaning that there is a bootstrapping script in the repository with a little bit of configuration. And the rest of the build scripts have downloaded at build time, which allows us to maintain, improve uptight, fixed bugs over time, without having to go to every single repository and update them.

00:11:05

We also had the requirement that I should all be able to run locally, as well as on the build machine so that developers could test everything that was running on the build on their machine for deployment and operation. We supported multiple environments and in some cases, multiple tenants within those environments support multiple cloud technologies, public private on-prem deployments. We also automatically configured monitoring for particularly our Kubernetes environments so that the teams could make sure that the applications were running the way they thought they were without having to set up their own dashboards again, saving them time.

00:11:52

So her progress far, each pipeline created with automated saves around about six weeks of initial effort plus ongoing savings. When we added up the time that it took to create each of the steps and set up all of the processes, such as set each build script up, we found that that time, at least at Honeywell took a significant amount of time to set up. And it was around about six weeks. Then there's the ongoing savings the teams are now using improved techniques. There's a lot more automated testing. These security tools are running every build instead of at the end. So a lot of the problems that were being found at the end of the development and now found throughout the development leading to a much reduced end phase overall, we're deploying a roundabout 250 to 300 new pipelines a month. And it's a bit cyclical, which has been an interesting research project to understand, sometime we have around 4,700 unique developers using the tool. And before I showed that we had about a thousand developers in the connected enterprise part of the organization, which means that we're expanding out well beyond connected, uh, and managing to bring in teams throughout the organization, which was our ultimate goal.

00:13:13

Some of the hurdles that we faced in building out this automation among many was it, some of our tools didn't support continuous integration. So particularly some of our security tools, which were perhaps a little older weren't capable of dealing with very short lived branches that were constantly being created and then destroyed. So generating and sharing results. As part of that, they would really struggle with. We still have within the organization, some manual processes before we go to production. And this is an exercise in trust and building up the capabilities and showing to the operations teams that we can release faster and we can release with less risk each time. And, um, so this is a trust that we're building up over time and we've managing to make inroads and develop the relationship to be able to release our products faster, but it is still something that we're working towards. We also, perhaps naively expected to have more of a contribution model from, from teams that were using the automated pipelines, like many, uh, open source applications. It turns out that only some developers external to our team really wanted to contribute to automate and or had the, the, the drive to contribute and improve. And other teams just want to use the output and then let us know when something wasn't working and ask us to fix it when there was new features to add.

00:14:50

So that's the automation section. We also have our measurement pillar. Again, we were lucky because of the accelerate book, that there was really a clear set of measurements that we could use at a high level. We had stability and throughput measures for our throughput. We had the deployment frequency and the delivery lead time for stability. We have a challenge, failure percentage, and main time to restore them to restore. This was part of that exercise where we try and prove that we can deliver safely and quickly and safe. Doesn't have to be slow as part of our measurements we used instead of some Python, scripting and influx database and Grafana to display the results. Here's an example of a one piece of our pipeline dealing with our deployments and the measures around our deployments. We can see that we have a number of product deployments per week.

00:15:48

We have some production lead time. So how long does it take for a commit to make it into production? And many of our teams have at the moment, sort of monthly or longer batch releases. So whilst the teams are deploying internally to lower environments, the production releases, uh, um, as too lengthy, but they coming down over time, we also have a set of dashboards around the performance. So again, over time, we can see how the applications are tracking. Every time there's a build and deploy, then a set of performance tests are enabled and run, and we can see what the performance was for specific tasks over a test run. And then what the average is across all of those tests runs where and where it's at trending.

00:16:40

Some of the hurdles that we faced with measurement was that some of our measures were harder to collect than we expected. And we're still working towards it, particularly the change failure rate, meantime to restore. So some of our stability measures, we brought a diverse group of verticals together, and those verticals were using a varied set of tools to measure their, uh, defects when they were getting raised by customer. Some were using service. Now, some you're using JIRA, some were using JIRA service desk and went home. There was up to eight different tools that were being used and we're gradually rationalizing those, but we still, haven't got to a consistent measure across all the teams, but we're making good progress there.

00:17:26

As part of that, we found that the, um, we could use proxies measures to measure those change failure rate. And meantime to restore, we use the deployment failures as a proxy for change failure, right? It's not ideal because if there was a defect that didn't impact, which didn't stop the promotion then and deployment, then that wouldn't be included, but it did give us a general guide to how often things were filing and how often we could restore them and repair them. We found the visualizing structured data was difficult in the tools. So we were using influx, which is a time series database, but sometimes we wanted to include information such as the team or the organization that was building a feature. I was working on a pipeline. Some of that structured data, not time series data was difficult to include in the measurement dashboards.

00:18:24

Okay. So now for enablement, enablement is really where we drive the cultural change in the organization. We'd have a small w wanted to have a small team of coaches. I wanted to have Spotify like guilds, which were guided by those coaches and within taking members from each team and, uh, translating information and transferring information out to those teams. And also the teams bringing it back up through the coaches and we figure out where we need to improve and how we can improve across all of the teams. We leveraged our existing communities of practice. So often we found that there was teams doing individual lunch bags, lunch, um, lunchtime sessions, Brownback sessions with their individual teams, but they weren't necessarily advertising that outside of their organization. So someone that was talking about best practices in unit testing wouldn't know that there was another time that they were also just given something on the best way to deploy to a particular type of infrastructure. So we developed some, uh, mechanisms to allow teams to share that more widely across the organization.

00:19:47

We also want to utilize our measurements to improve a team's performance. Some of these items we hit and some of them we're still working on part of the enablement was training. We have monthly jumpstarts. It took us a while to get to the understanding that we needed to run these very frequently. We thought we could just run them, occasionally, get a whole bunch of developers and, and, um, and teach them, but it didn't work out that way. We needed to do smaller, more hands-on focused sessions with the developers, so that they really got a chance to dig into the technologies that were involved. We had, we have a weekly open hours, so sort of drop in sessions. If someone's got a question about, can automate do this, or how would I achieve that then that we've got a spot where they can just drop into a virtual room and ask some questions. And we also do quarterly product deep dives, uh, before COVID this used to be in in-person workshops where we would all come together as a, um, into a particular team, and then work with that team, usually legacy code to figure out the best way to bring, to sort of modernize the pipelines into the automated system.

00:21:04

Another part of our automate or an enablement was online support. We neglected this were a bit naive at the start where we didn't include this in our original planning. Uh, and that costs us a little bit, and it was very organically grew over time. It turned out that our automated developers became the front nine frontline for everybody's problems. So automate was meant to be a self service portal. People create their pipelines as if they were using all of our individual tools to do that themselves, and then they'd have their pipeline that they would work with because they ended up with a pipeline. We almost, uh, that was created for them. We almost created a problem by making it too easy for them. We created our own problem teams. Would I type in a name, choose a template type, press return, 10 or 15 minutes later, they'd have an API that was stood up in Kubernetes with an end point that they could hit, uh, having to run all the tests and, um, deploy the application.

00:22:12

Now there's a lot of stuff that goes on in there. And we found that teams didn't, weren't learning or didn't understand the technology. So some teams weren't familiar with Kubernetes with containers even, but the code was being delivered in, running in a container. And then there was this gap where if they needed to make a change or debug something was going on, they didn't quite understand it yet. So that was, uh, a change where we had to, um, we had to run some more training, but also we became the first point where if there was any question at all, if the build broke, the first thing people would do is ask, ask on the online support for, for some help. Unfortunately, people didn't always, uh, think carefully about what they were doing. The questions I'd asked first, or even necessarily look at the logs. Here's an example of one question that we received. This is the full question. Can someone help me here? There are no changes to the repo. And I was very impressed with the person that responded to this. I thought they were, uh, much more rational than I would have been. I said, can you specify what you need help with? I may not be, have been quite as polite.

00:23:23

So in order to try and deal with the fact that we had a lot of people asking us frontline support about just the technology, that different types of, um, tools that were running in their application, we created a little bot, call it a template support bot, and that allows people to basically use a tree of questions in order to fall in order to solve their problems. So in this case, the person has drilled down into their builders broken, and then they can choose from the various areas where the build might be broken. So if it was a security job, then perhaps the, uh, they've got a vulnerability that they need to address. And if they clicked on that, then I would get a list of options about, okay, here's how you understand what to do when you get a vulnerability.

00:24:13

That was one area where we used that we got some good success in trying to ease the burden for us on our, um, on our enablement. I talked to the start about the goal of having coaches to, and to build up Spotify guilds that didn't really pan out for us. We found that it was extraordinarily difficult to hire coaches. We at least struggled with this where, because often we were getting people who might've been excellent coaches, but had, uh, either no or a very shallow understanding of DevOps. And when you're trying to explain to a team why they should be using continuous integration instead of feature branches, it often helps to have a good understanding to have been there, to been an application developer and made that realization yourself. So we struggled to hire coaches.

00:25:02

We also had organizational inertia, and this is something that we're expecting, but it's still hard to, hard to work through where teams have been doing things for a long time. That's the way they'd been doing it. Business processes have grown up around, um, creating batched releases over large periods of time. Those sorts of things take time to work their way through. And we're still working through that. We had pockets of excellence in the organization where some, at least one part of the organization was doing each of the capabilities in an excellent way. However, getting those teams to teach everybody else how to do it was something that was a challenge as well. We were expecting. People would love to share about how they did something the best way. However, it turns out that some people didn't think that that was their job, which probably wasn't a, and they weren't that keen to, um, sort of spend time helping everybody with it's understandable when they've got other features to, uh, release, but we were, weren't really expecting that. So overall, we provide a lot of capabilities to teams, how for a year to realize the full potential of it across all of the teams, we have a very successful automation rollout with higher adoption rate, reasonably successful measurement, roll out. However, our enablement still has a long way to go and that enable will enable the measurement to be more successful as well. So that's a three pillars. That's what we learned so far in two and a half years of bringing a DevOps culture to Honeywell connected enterprise. Thank you.