Iterative Enterprise SRE Transformation

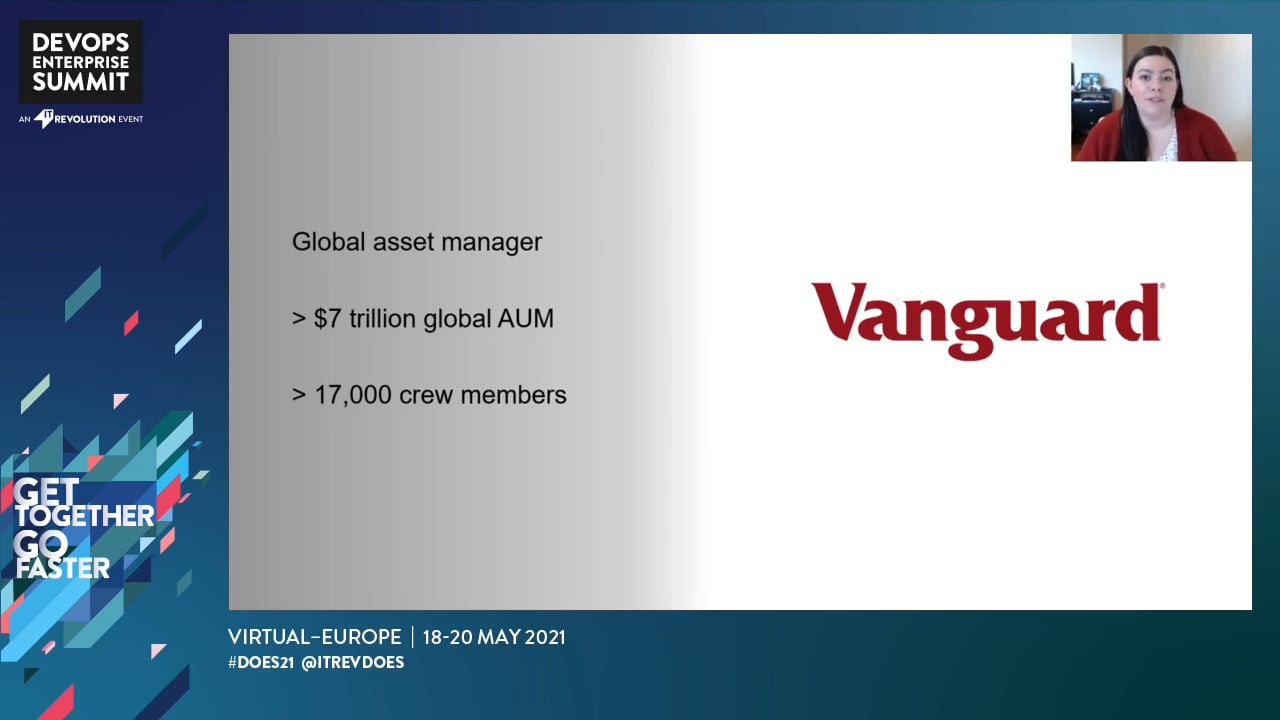
It's easy to get discouraged reading books about industry best practices that say things like "always test in prod!" and "10 deploys a day!!" At times, they can make the goal of being a high-functioning DevOps organization feel out-of-reach for large enterprises, where changes to the way we operate take time to roll out. A few years ago, Vanguard started its journey to adopting Site Reliability Engineering across the IT organization, and that transformation effort is still underway today.


In this talk, we will share where we started, how far we've come since then, and all of the steps we've taken along the way, as we've worked to evangelize changes to the way we measure availability, enable experimentation, leverage highly-available architecture patterns, and learn from failure.

CY

Christina Yakomin

Site Reliability Engineer, Vanguard

Transcript

00:00:13

Hello, and welcome to iterative SRE transformation. My name is Christina Yacktman and in this presentation, I'll be sharing with you the steps that Vanguard has taken over the past five to seven years to adopt SRE best practices to make our dev ops teams more effective. Vanguard is a very large enterprise. We're a global asset management company with over $7 trillion in assets, under management, and we've got over 17,000 crew members working here. So as you can probably imagine enacting any sort of change, especially to our processes, the way that we work and the technologies that we use can be incredibly difficult and often time consuming. We need to be very intentional with every change that we make. And sometimes there's going to be a bit of trial and error along the way as for myself and my current role. I am a site reliability engineering coach for our it organization.

00:01:19

Prior to this, I have experienced with full stack application development, as well as cloud infrastructure automation. And I've picked up a few AWS certifications along the way, including the solutions architect professional. In my prior role, I was on our chaos and resilience engineering teams. So I think of myself as a bit of a chaos engineering enthusiast. And if you've heard me speak before, it may have been about our chaos engineering tool set outside of work. One of the things that I really enjoy doing for fun is visiting the Philadelphia zoo, where I am an annual member to take photos of the animals there.

00:01:58

Now I'm going to rewind, like I said, about five to seven years to paint the picture for you, of what our environment looked like. Then this will really help demonstrate just how far we've come by the time we get to the end of this presentation. At this point in time, we had not yet begun our public cloud migration. All of our monolithic applications were hosted in a privately owned data center. We have extremely controlled deployments operating on a quarterly release schedule and the development teams, weren't the ones deploying the applications. We had specific deployment teams and operations teams. Everything was very separate. We had alert only visibility as I call it here. No dashboards, really no positive affirmation of functioning. We assumed if we weren't getting an alert that the application was up and running to make worse ownership of alerts was centralized. So in order for an application team to get a new alert, configured, they would need to submit a request to a central team and wait for them to have some spare cycles to actually get that alert set up. Things moved pretty slowly, finally completely separate silos for Devin ops, not just in the context of deployment, but the development teams or purely responsible for feature delivery. And our operations teams were responsible for production support and availability.

00:03:37

So how do we get things started? It's impossible to talk about this journey without talking about our migration from a data center to the public cloud, in order to do this, we had to break down the monolith. It was going to be very difficult if it was even possible to lift and shift monolithic applications from our data center into AWS. So instead we started slowly carving out microservices, initially running them on a platform as a service private cloud, which we were running in our data center. As we carved out these microservices, we were able to reduce the duration of our regression cycle. We introduced a test automation engineer role to create automated tests just for that smaller slice of functionality covered by the service, making these services able to move a little bit more agily than our monolithic applications would be able to. Now we're not in the public cloud yet, but we're making a lot of progress toward a better operations model. Not only were we able to increase our deployment frequency, but after a certain point, we even were able to automatically generate change records and attach automated test evidence to increase the velocity of our change management process.

00:05:11

Once we got that far, we were able to focus on lifting and shifting that platform as a service, putting that in the public cloud, that would mean that all of those applications, those microservices that had been running in the platform as a service on premise in our data center would need to make very few changes in order to complete their migration to the public cloud, because the platform would be the same. However, this was incredibly difficult for the infrastructure teams that actually had to do that work. I was one of the engineers on that team and it was a headache. And ultimately once that was done, while it expedited the cloud migration for our many microservices that we had at this point, it left us with a now unnecessary obstruction layer that ultimately just over-complicating our environment and causing quite a few more problems than it was solving.

00:06:15

The next step was to take those microservices that were running in the public cloud in our platform as a service and get them out of that abstraction layer into a more cloud native solution. This was going to drastically reduce the operational complexity for those intermediary infrastructure teams. Like the one that I was on that put that platform as a service in the cloud in the first place. And let us leverage the really great resources that public cloud providers like AWS provide out of the box. Initially ECS far gate looked pretty much exactly like what we were using before really low operational complexity. And now no operational overhead of maintaining that platform as a service, the containerized microservices were able to move from that platform over into ECS far gate. But then our goal was to say, is this really the only option? And it wasn't, we'd carved out microservices and all of them worked a little bit differently for some of them.

00:07:24

It actually made more sense to put them in something like AWS Lambda for a truly serverless compute option for others, where they could benefit from the control plane of Kubernetes. Amazon EKS is a good option. So we now start to explore some of those more cloud native solutions outside of the paths would this done now is shift a lot of that infrastructure responsibility out to the various microservice application teams and with great power comes great responsibility. They're able to leverage all of these great new features like auto scaling, automated task replacement, but they need to test those configurations. They're no longer centralized by our, on premise configurations or our platform as a service configurations. So they needed to adopt a lot of new processes into their day to day in order to ensure that they were doing this effectively. Some of these processes included the failure modes and effects analysis exercise, where teams will take some time to look at their architectures, identify possible failure modes and hypothesize together as a team.

00:08:40

What they expect the effect of that given failure would be if consensus can't be achieved, further analysis might be required. And once consensus is achieved, you now have a great list of hypotheses that you can apply to the next process, which is chaos, engineering and experimentation. We use chaos engineering to validate the hypothesis that we have about the way that our systems behave in times of stress. Speaking of stress, the other way to test our systems is with performance testing. This is nothing new to us, but like many things in our old way of operating performance testing used to be very centralized that worked all right when we had quarterly releases, but as we drove down our deployment frequent or our deployment lead time and increased our deployment frequency, we needed to increase the frequency and flexibility of our performance testing as well. We actually ended up building a performance testing as a service application so that every individual product team had access to the hosted load generators that they needed to test their own applications.

00:09:54

Now, this can sound like a lot of additional cognitive load on these teams, but we've already seen some really great successes in this space that I wanted to highlight quickly before moving on first with chaos game days, this concept of having a hypothesis and then validating it. I worked closely with some of our advice application teams to develop these hypotheses about system resilience and then purposely cause crashes to different components within the application. We validated scaling behaviors and self-healing, and this was particularly helpful for teams that were getting used to operating in a cloud native environment. For the first time I've seen chaos engineering be just as effective, if not more effective as an onboarding tool, as it is for actually testing the systems. Next up was our chaos fire drill. This one's a little bit different because we purposely injected faults that we knew would raise alarms within our system.

00:10:55

The reason we did that was because it wasn't the systems that we were trying to test this time. At least not the application systems. We were trying to test out our new observability tool set, which had promised much easier troubleshooting. And we wanted to get some hands-on experience using the tool before we set it live in our production environment. So we injected those faults, which should have raised alarms and validated did the alerts fire, and then how easy was it to troubleshoot? I didn't always tell the application teams where I was going to be slowing things down and I let them do some sleuthing within the distributed tracing tool to see if they could identify the source of the latency, worked out great and proved to be a really great learning tool that we now have the recording for and reuse again, as part of our onboarding and training processes.

00:11:50

Finally break testing our CIC pipeline. I like to talk about this one because I think it's something unique that we have done that I haven't heard a lot about across the industry for RCI CD. We're not using a SAS tool. We are using a vendor tool that we are hosting in our cloud environment. And as part of just being a really large it organization, sometimes we run into growing pains and as we were onboarding many, many new microservices to this CIC pipeline, we started to observe frequent recurring instability during high traffic times. That's the worst time to be observing instability because high traffic for a CICB pipeline means it's your highest productivity times. Ideally for the engineers who are trying to run CII builds and deployments, but sure enough, we were seeing crashes and to make matters worse. Those crashes were preventing thorough investigation because they were wiping out the critical logs that we needed before they could be offloaded to our log aggregation tools.

00:13:02

So we were flying pretty blind in order to troubleshoot this and ultimately identify the bottleneck. We got online on a weekend and did some really inventive engineering to try to recreate the condition. How do you really performance test a pipeline? We had to create builds and deployments that recreated certain resource intensive conditions. Ultimately, we were able to recreate those crashes while someone was watching the log file, be created, capture the thread dumps and log files that we needed, identify where the bottleneck was and address it that same day. So come Monday, we were seeing immediate improvements to the performance of our pipeline. It's not really a chaos experiment. It kind of blurs the lines between cast experimentation and performance testing, but it's a great example of one of our teams truly operating in a dev ops, fully independent ownership model for their tool.

00:14:09

Now, we talked a lot about that cloud migration, as part of that, I mentioned breaking things down into microservices, increasing deployment frequency, but what I haven't yet addressed is our observability journey and finding the right tools for the job. Don't forget that where we started five to seven years ago was truly alert. Only visibility. We'll go quickly through this timeline to show the progression of our observability practices without really getting into the details of the tool sets. Initially, we had those alerts, those birth legacy alert consoles, but those were still primarily utilized by the operations teams. Development teams did not get involved in responding to alerts. In most cases, they just page production support. Eventually we started actually looking at live dashboards, which were pretty much just populated by logs, but again, this was focused on the infrastructure teams as we started to carve out microservices, that platform as a service gave us a key benefit.

00:15:24

All of those applications were operating in the same containerized environment. So all of their logs were filtering into the same places in the same ways. We were able to create some standard microservice platform dashboards, which initially were intended for use by the platform owners, the infrastructure team, so that they could see if there were individual problematic microservices that might be offsetting. The overall health metrics of the platform indicating a platform issue where there was really an application issue for a high traffic application. But we quickly realized how beneficial this was for the application teams themselves. And they loved it too. They started looking at those dashboards and working together with the infrastructure teams to make them a little bit more customizable and easy to access over time. As feature requests rolled in the addition of logs from the cloud provider, as well as metrics started flowing into the same tool teams got better and better at using the tool and slowly but surely would clone or recreate the dashboards that had been originally created by the infrastructure platform teams to make them their own they'd add their own panels to solve their problems that were specific to their use cases and their definitions of availability.

00:16:56

But sometimes these dashboards were more likely to create confusion, then solve problems. If the engineers didn't actually understand the underlying data, maybe one of their team members created the dashboard, but now someone else is on call. They might misread the information presented and make the wrong decisions about how to proceed. So coming to a decision around how to best onboard all of these teams was something that we felt like we were playing catch up on from their teams, started building alerts into this same tool because it had the capability for that. So now teams just happened to have their own custom dashboards and alerts, and they're going pretty crazy with it. They love it, but there some benefits and consequences benefits are obviously you can move really quickly. You're no longer submitting those requests to central teams, total flexibility. You can make data-driven decisions right there as part of the application team based on how your applications availability is looking.

00:18:07

And it gives teams more motivation to have an increased focus on production support. Now that the information is surfaced to them, they naturally felt more inclined to get involved, but some of the consequences were dashboard clutter, ignored, alerts, alert, fatigue. We gave teams this access and this ability to customize without first ensuring that they had all the information that they needed about best practices for alerting and dashboarding. So in some cases they were alerting or monitoring the wrong things or too many things. This led to obviously ignored alerts. Like I mentioned, a really rough signal to noise ratio and at its worst burnout for engineers on call following this because we had so many different dashboards and alert queries running, we started to see another concern raising up as well. Everything was logs. And that may not seem that problematic on the surface, especially because this made it really easy to use. Everything was in one tool and everyone only had to learn one querying language, but the scope was increasing utilization was increasing. And honestly, just because you can do everything in a log aggregation tool definitely doesn't mean you should. We started to see rapidly increasing costs and degraded performance for the tool. The last thing you want when you're troubleshooting a critical incident is to be held up by the performance of your dashboards. That's not good. There are better ways to store more structured or quantitative data than the unstructured string data type of a log.

00:20:08

So we put metrics and traces where they belong, pulling them out of this central tool and leveraging tools like Amazon's CloudWatch for metrics and honeycomb for traces. I mentioned before the chaos fire drill that we did to validate the efficacy of a new tool that was honeycomb, we were using the distributed tracing functionality offered to us by honeycomb to see how much easier it would be to identify the sources of latency within a complex web of microservices. Because in many cases to get from the user interface all the way down to the data store and back you were encountering many, many different unique microservices, depending on the makeup of an individual investors account structure, as part of this move to distributed tracing and the adoption of honeycomb. We've also standardized around open telemetry. We see this as an investment for the future, learning from some of the mistakes that we've made in the past with other tools, my standardizing around open telemetry, we believe that we'll be able to better avoid vendor lock in.

00:21:22

This is because we don't seem to be the only ones standing or standardizing around the open telemetry framework for sending telemetry data to back end collectors. It seems like the industry, at least in the observability tool sets standardizing around this as well with many of their ability tools, offering integration with open telemetry collectors out of the box, making it very easy for us to swap out backends in the future for our logs metrics or traces. If we deem it necessary as a part of this investment, central teams are developing shared libraries for the application teams to take advantage of, to extract common fields. For example, that we might want to add to our trace context on a regular basis. One example of this common fields might be the numeric client identifier that we use at Vanguard.

00:22:19

Now let's talk a little bit about the more recent changes that we've made related to SRE best practices. One of these is really changing the way that we measure availability, application teams have their own way do customize alerts and dashboards. We have all of this great telemetry data available to us, but if we're still talking in a very binary way about availability, there's no nuance and we're shooting ourselves in the foot up as good and down as bad is really just an implied attempt to achieve 100% uptime, which is an impossible goal. And if that's what you're shooting for, you'll burn yourselves out on both engineering capacity and funding, trying to reach such an unattainable goal. We needed a different way to talk about availability amongst ourselves in it, and also with our business partners. So we've been rolling out the SRE practice of using SLIs and SLOs to talk about availability, that's service level indicators and objectives.

00:23:23

The example that I have on the screen right now is not a real example from a Vanguard application, we would use slightly different numbers, but it's illustrative of the point in this case, instead of saying an application needs to be as fast as possible and always available, we're setting reasonable thresholds based on the expectations of the clients, the users of the application, 95% of responses should return a successful HTTP status. In this case, a status code of less than 500. And in terms of latency, 90% of requests should respond in less than half a second. While 99% of requests should respond in less than two seconds.

00:24:07

Now, moving forward, we've talked about the progress we made in our cloud migration, our move from monolith to microservices, the shift of responsibilities onto these dev ops teams and the observability journey. But I'm not here to tell you that we have it all figured out. We definitely still have some questions that we need to answer and some progress we'd like to make a lot of these questions surround striking the right balance. The first being the balance between efficiency and flexibility. There's been a lot of tension between providing recommendations and standardization versus providing teams with freedom, flexibility, and the option to deviate from the norm, of course, standardization will reduce rework. It makes it easier for teams to repeat the same patterns and that way it increases efficiency, but it limits flexibility and customization. And at times can lead to shoehorning certain use cases into patterns that don't quite make sense for them just because that's the standard.

00:25:19

We're also trying to strike the right balance between time spent training and time spent delivering. This is especially important for me on my SRE coaching team. And we're definitely still figuring out what the right balance is. As I mentioned before, with our monitoring tool set, when we gave everyone access to do whatever they wanted with custom dashboards and alerts, it started out great. But ultimately we identified a gap in knowledge of the best practices. We didn't quite hit the mark on the right amount of training. So how do we make sure we spend that right amount of time, upskilling and training on these new processes and tools without taking away from the fact that obviously these product teams need to be spending their time delivering new features to their business partners. We have to identify what that base level of knowledge is that you need to take advantage of a good observability platform and deliver just that much think Alina VP, but for upskilling, looking ahead to the future, we'd like to continue to reduce our on-premise workloads.

00:26:27

If you find that surprising. Considering I talked about all of our migration into these cloud native solutions, we're not a hundred percent there. Portions of our environment are still monolithic applications running in a data center though. We've moved a lot of applications. We haven't moved them all, but we'll continue to reduce that on-premise footprint over the next several years. We also have aspirations to be what we call fully observable. We've got a lot of that great telemetry data now, but one thing that we're missing is a single visualization tool to aggregate the data we're dealing with disparate sources now, because we've put those logs metrics and traces in the tools that are going to be most performant and most appropriate for surfacing the data. But sometimes you really do need to aggregate all of those sources. So we'll look to incorporate something like that into our environment in the next couple of years.

00:27:25

And finally, we still have some room to grow on blameless post-incident reviews. We're doing great with build and run, adapting our development and operations. But when incidents do occur, one thing that we've started to see just a little bit of really great success with is sharing knowledge throughout our it organization so that everyone has an opportunity to learn. This requires really thorough analysis. It requires time and it requires documentation and writing things up in a way that anyone could understand whether or not they were involved in the incident, but when it's done right, it has maximized learning for the entire organization and improved our ability to operate as effective dev ops teams with that. I want to thank you so much for your time and attention today. I'll be available on slack for the next few hours. Uh, if you have any questions that you'd like to ask me, uh, I'll be chatting there throughout the day. I hope you enjoy the rest of the conference. And if you'd like to reach me after the conference, feel free to connect with me on LinkedIn. It's just Christina Yacktman or on Twitter at SRE. Christina. Thank you.