London 2019
Time Theft - Using Flow Metrics to Expose Crimes from Conflicting Priorities and Unplanned Work
Today’s IT workers are drowning in nonstop requests for time, days filled to the brim with meetings, and endless nights spent heroically fixing problems. The real crime of the century is time theft - one of the most costly factors impacting enterprises in their day-to-day operations. In this talk Dominica reveals what you ought to know Flow Metrics and how they can help you expose time theft so you can make better business decisions.
Time Theft: Using Flow Metrics to Expose Crimes from Conflicting Priorities and Unplanned Work
Dominica is the foremost expert in Kanban Flow within the IT industry today.
Her work shows technology and business organizations how to optimize workflow across value stream networks. Her passion involves the use of visual cues and transparency across teams and organizations to reveal mutually critical information.
Dominica is a regular speaker at global DevOps and Lean events and has recently published her first book: Making Work Visible: Exposing Time Theft to Optimize Work & Flow.
Along with being a sought-after speaker at industry conferences, Dominica writes articles for industry publications such as Cutter IT and TechBeacon.
DD
Dominica DeGrandis
Director, Digital Transformation, Tasktop
Chapters
Full transcript
The complete talk, organized by section.
Dominica DeGrandis
Thanks for coming. Good to see you all.
I'm Dominica DeGrandis, and I spend a lot of time helping organizations make their work visible so they can see where bottlenecks are and pain points, so then they can start to do something about it. I work for Tasktop. Lovely company, delighted to be there.
In this session, what we're going to do is we're going to look at some of the problems that are caused by time thieves, so conflicting priorities and unplanned work and unknown dependencies and whatnot. And then we're going to see how we can expose those problems using flow metrics. All right? So the plan is to expose these common problems using flow metrics so that you can make better business decisions.
And the whole point of this is that there's no lack of data collection at the team level. Right? If you've got MTTR and you're collecting your change failure rates and how much load teams have, then at the team level, it's easy to optimize for that and to see how you're doing and make improvements. The problem is that there's few compelling sets of data at the high level, at the organizational level to help you make better decisions.
And so if we bring in flow, most of you already know probably, flow is the first way of DevOps because in order to deliver customer value quickly, work needs to flow rapidly and smoothly and predictably through the value stream.
So we are working to help decision makers primarily. How many in the room are decision makers or upwards leadership? Okay, great. Because this is what flow metrics help provide, trying to help you improve your business decisions.
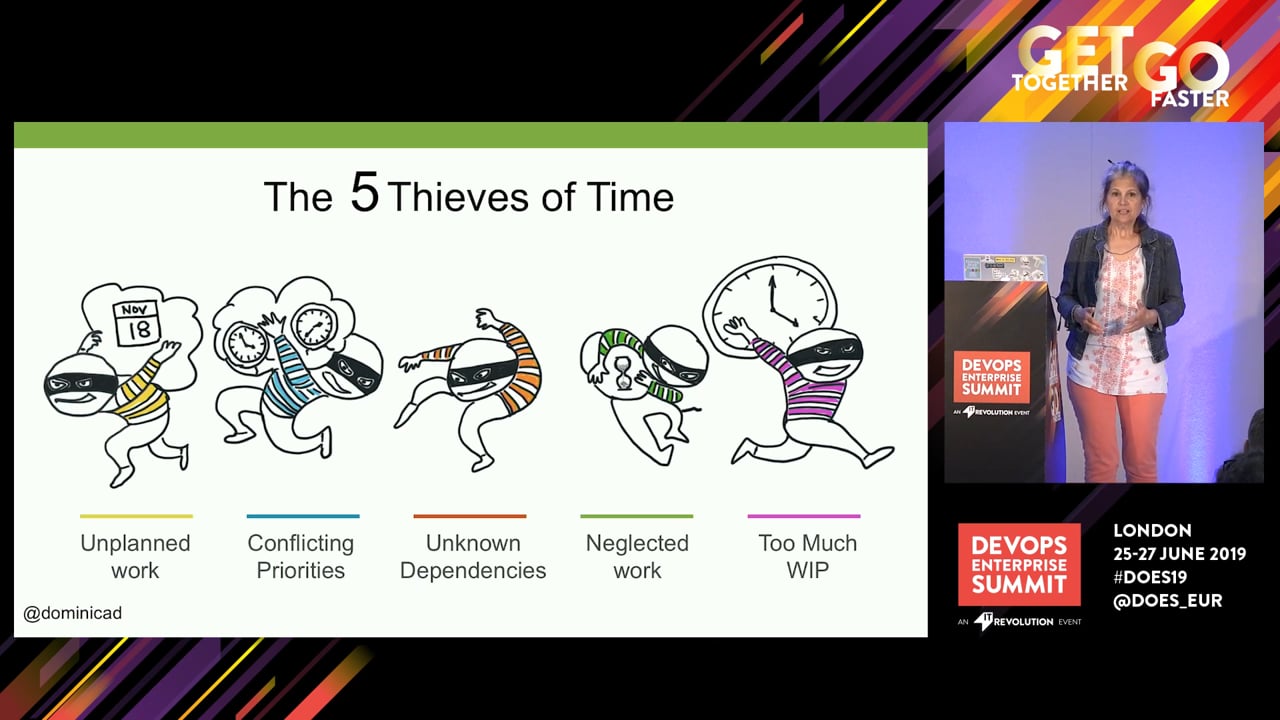
So there's five thieves of time that I believe if we could expose, make visible, start to track, could help us improve our throughput in delivering value. Let me introduce them to you real quickly.
In yellow on the left is thief unplanned work. These are the interruptions that plague our day. These are the, "I can't get the build to compile. I can't log into the test environment. Can you help me?"
In blue is thief conflicting priorities. These are all the questions like, "Well, are we supposed to be working on A or B right now?" And if the answer comes back as both, then this thief is probably trolling you.
In orange in the middle is what I call the big bully thief. This is thief unknown dependencies. These are the, "Oh, by the way, the schema changed yesterday. Didn't you get the memo?" Right?
And then in green is thief neglected work. This is usually important work, but it keeps getting delayed, usually by some kind of revenue-generating promise, and you keep pushing back on neglected work.
And then on the right in pink, that's the ringleader of all the thieves. This is thief too much work in progress because in one way or another, all the time thieves play into us having our plates too full, just having too much work on our plate.
If I were to come up with another time thief, I would probably come up with maybe anti-patterns with metrics and how they measure individual teams. Right? Because this is from John Smart's talk last year. How many of you saw that fabulous keynote? And he's talking about, look how agile we are in dev. Yay. Right? And so when we're just measuring and trying to optimize for one particular function or silo, this is what can happen.
But upstream, there's all kinds of problems going on. You got a monthly triage process. There's a quarterly steering committee review where there's prioritization happening, and then there's annual approval meetings that need to occur. So if you want something done in 2020, you need to have had it approved by 2019. Right? How can you call yourself agile or DevOps if you've got these huge extended wait times upstream? It doesn't really matter how fast one piece of the value stream is moving when the bottleneck is somewhere else.
And so if you're doing the DevOps, maybe the right-hand side of the value stream is all automated and rolling fast. If not, if you're still doing monthly integration and quarterly releases, now you got bottlenecks on both sides of your optimized development function.
So what to do about this? We're going to look at five flow metrics. Okay? Flow time, flow velocity, flow distribution, flow load, and flow efficiency. And we're going to show you how to expose the time thief problems so that you can do something about it.
And we're going to start with-- Can I get a clock going up here? Thanks. So we're going to start with thief unplanned work. This is the problem where things take too long because when I ask most leaders what their biggest pain point is, they say things take too long. Right? We're always waiting on something.
Often, not always, but often things take too long because of unplanned work. It's all this variability in the system, all these things that we can't anticipate, all these things that we don't know yet that then interrupt our workflow, and it's what delays planned work. Unplanned work delays planned work, and it's often invisible. This is an attempt here to bring some visibility to unplanned work because usually it is just invisible. We can't see it, and it's what steals your predictability away.
Right. Sometimes we'll set target dates, maybe arbitrary, but we need to get this thing done by October. And if we're only tracking the planned work, then all the unplanned work, which is what is preventing us to get work done, why things take longer, is invisible.
And so because of that, because people will grumble about things take too long, my first question is, well, how long are things actually taking? Right. How are you measuring speed? And there's a number of different ways organizations measure speed. Traditionally, they look at lead time, and in the literature, lead time is typically from when the customer declared they wanted something to when it's available for them. If we're looking at The DevOps Handbook, then maybe we're interested in delivery lead time, which measures the right-hand side of the value stream. Right. Code commit to when that's done.
But in all the work that I've been doing with organizations, when I ask them, "Where do you want to start the clock?" Often they come back with, we want to start the clock at the point where we've decided, yes, let's do this thing. Because that's going to give us a really good indicator on what's within our control, what we've decided to do that we're going to fix.
And we're calling that flow time. Flow time has actually been around for a really long time. I didn't make it up. I just started using it about four years ago because my tolerance for the arguments between the difference in cycle time and lead time grew very thin. And I was doing research, and I found Little's Law was proved out in the 1960s, and they used flow time to identify the point when work comes into the value stream and when it goes out. So start the clock where you want with flow time, but in my experience, it's a very interesting measure from starting at when we've decided, yes, let's do this thing.
And so flow time can-- I like to use scatter plots for flow time. There's other ways to do that, but this is showing every work item or artifact or story or epic, whatever term you're using for your work, is identified and how long it took to do and the date that it was completed. So the horizontal axis is the date that the work item was complete, and the vertical axis was how many days it took to do.
So in this chart, the legends on the right, we're identifying revenue-generating work with a black dot. So this would be your features. And then I'm identifying revenue protection work. That's the circle and the dot in the middle. Revenue protection work would be a combination of your technical debt and your things like risks and security and compliance. And then I've highlighted unplanned work here because if you're tracking unplanned work, it's going to show up in your data, and then you can present this to people to explain why this feature that that purple arrow is pointing at was delivered a week later than the target date.
If you're not tracking unplanned work, it's not going to show up in your metrics, not going to show up in your flow time, and then when the VP of whatever asks you why their new platform isn't up and running yet, what do you say? You say, "Well, we've been really busy." If it's not tracked, it's invisible, and it's the perfect crime. If you can track it, you can start to help people see why work is taking longer than they think it ought to take.
Wouldn't it be great if we could start to forecast and be more predictable? Right? We're trying to be approximately right instead of exactly wrong. That's what we're using flow time and probabilities for instead of just setting an arbitrary due date that people will march down toward.
And then this might be a little bit next steps, but consider using percentiles if you're interested in forecasting and probabilities. Oftentimes, we just look at the 50th percentile, which is what? The average. But if you're just using averages, then you're going to be late or early half the time. If you select 85 percentile, that means-- Or this is an example of a 90th percentile. That means that nine times out of 10, we are going to deliver feature work within 20 days based on this data set of 30 days of one month. And when it comes to data sets, it only takes 11 samples to get to the 85th percentile and about 20 samples. They have to be random, but 20 random samples will get you to a 90% probability of your work arriving on time. So I think this data is useful to convince others may be suffering from misconception that things can be done sooner than they actually can be.
All right. Thief conflicting priorities. So the problem here is team A's top priority is not team B's top priority. Yeah? And so if there's all these projects happening all at the same time-- Because we can only do one thing at a time, I can walk and eat and maybe talk at the same time, but I'm not going to re-architect our architecture and do some coding in Clojure and update YAML files in Kubernetes. When it comes to complex work, we can only do one thing at a time.
So if I'm heads down working on project A, that is a decision to not be working on project B, because the decision to do one thing is the decision to delay something else. And so with this, because there's so many competing priorities, it's blocking flow, and what measure-- We're going to look at flow velocity to see how many things we're getting done. Flow velocity, it's like throughput. How many items, how many features or work items or stories, whatever you want to call them, did we get delivered?
And I like to overlay it on top of flow time, because then you can start to see the impacts of one metric over the other. If you can start to show how one metric is impacting another metric, that's extremely powerful. You can start asking questions like, "Did these emergencies that pop up that caused our features to be delivered late, did that impact the number of features that we could deliver? Is that why the flow velocity dropped?"
Next up is thief neglected work. So usually, important non-functional requirements, oftentimes things like technical debt or security items that don't get prioritized by product owners and business people if they're focused on just delivering revenue-generating work like features. How many of you have some of this going on? Yeah, like half the room.
And so flow distribution is a metric that will help you with the problem of neglected work. Flow distribution is a way to look at your categories of work. So imagine your work and you're able to sort of just tag each work item into one of these buckets. It's either some kind of revenue generation work like a feature, or it's a defect, or it's some kind of a risk, like a security breach or something, or it's technical debt or internal team improvements. Maybe there's a miscellaneous column.
But the bulk of most of our work can fit into these four categories. And if you're measuring this, then you can start to understand what the trade-offs are and have conversations. This chart will help provoke necessary discussions on what our strategy should be like going forward. While we worked on a bunch of feature work and we got out a new release, but now we need to allocate more time to fix defects or look at risks, or maybe we ought to fix technical debt.
And if work is categorized like this, then you can start to visualize them when they're work in progress. So here's an example of doing that. It's a board that is showing the four different categories of work and a way to allocate capacity to ensure that it-- If your strategy says that we always want to have at least one risk work item in play, then we can allocate that in our work in progress limits like this.
This is showing that we could have five features going on at any one time. Oftentimes you'll see work in progress limits at the top of each column, but there's no rule that says that you have to do that. You can allocate work in progress limits by work item type.
I've seen it where teams will always allow themselves to have one internal team improvement going on at any one time. So in this case, they'd allow themselves some green, some debt work there. And it helps others see the conflicts of priorities across the org too.
This is an actual look at the data, representative data from a release that we did where we were really focused on getting a new platform out, so much so that some of our customers wanted to get a hold of it and this went out before GA. And so what happened was then we had this build-up of defects that we weren't really expecting. And so we took a look at this, and this is what allowed us to say, "Hey, wait a minute. We need to work on some technical debt and make sure we get these defects done." So it helps you have those kinds of conversations.
Next up is thief too much work in progress. So this is when, in the textbook terms, the demand is more than the team's capability to meet that demand. It's out of balance. We're saying that teams are just drowning. They're overloaded. If you saw Christina Maslach's talk yesterday on burnout, this was one of the contributing factors to burnout, is overload, where people are overwhelmed, and that's what causes exhaustion.
And when we talk about WIP, this is all your work, all your unplanned work, all the Post-its around your laptop, all the tickets in your ticketing system, all the interruptions. Too much work in progress comes from too much yes. I'm going to do an Ignite talk about that tonight if you want to hear more about that. But the single most important factor that affects how long things take, remember our friend, things take too long, is how loaded people are. Like loaded, as in what their workload is.
We call that flow load, which I'll talk about on the next slide. But the most important thing for you to know about work in progress and flow load is that it's a leading indicator. Just like when you get on the freeway and it looks like that, it's backed up to backed up, you know your commute is going to take longer. Right? Same if you've got way too much work than the team has the capability to do, things are going to take longer because people aren't available when you need them to be.
And so for flow load, all that partially completed work, we're really interested in a lot of these metrics, including flow load on the trend over time, because it's going to go up and down depending on what your organization is doing, could depending on if you're hiring or reorganizing your teams. But flow load is one of the few leading indicators that I encourage you to check out.
A quote from Jim Barksdale about opinions. I just have to say that, so my background, I was a build engineer. I spent a lot of time doing configuration management, releases, build and deployment automation. And the development always used to complain that things took too long. And I used to, of course, take that personally and rant that builds don't take too long, it's because we don't have automated testing.
But ranting got me nowhere, absolutely nowhere. Once I could start presenting the data in a calm fashion in front of leadership, it just blew me away because I got budget, I got headcount, but probably more importantly, I got empathy on the role and what we were trying to do.
So thief unknown dependencies. Software delivery roadmaps can appear pretty organized if you look at them in this hierarchical view like this, where their portfolio's at the top, and then that breaks down into projects, and then that work breaks down into individual team boards. But the details can get lost as work flows across all those different levels, especially when handoffs and unknown dependencies pop up, and this happens all across the organization.
I was working with a sales ops team. These are the people who do statements of work and NDAs and terms and conditions and contracts so salespeople can close deals. And I asked them, "What is your work intake process like? How do you get work?" And they said, "Well, it comes via email." And I said, "Okay, then what do you do with it?" And they said, "Well, we copy it, and we put it in Jira, because that's our workflow tool." "Okay, well, then what happens?" "Well, then we actually put that information and the updates and any attachments back in an email, and we send it back to sales, because sales is working in Salesforce. They're not working in Jira." And so information goes back and forth and back and forth and back and forth in emails and the data, it's just things get lost, and so it impacts their collaboration, and it delays delivery. It interferes with delivery.
So things take too long is a universal problem, really, no matter what department or company you're in, and it's a problem that every company grumbles about. And when it comes to all the different tools, we have more tools than ever before. So my first job out of school, I was doing builds on IBM mainframes. I had to work with four or five tools, just C and JCL and Assembly language and what else do they have? COBOL.
Now, there's this XebiaLabs beautiful periodic table of DevOps tools, has over 120 different tools in it. But this is what the DevOps community is saying: allow teams to use the tool of their choice, because they should have the ability to use their best-of-breed tools to do the job the best way that they can do it. All right? Let people use their tool of choice to get the job done.
But the reality of the situation is that people are working with their team in their tool of choice, and each team is using a different tool, and there's a lack of integration. So people have different views of the world. If I'm in service management, my view of the world might be in something like ServiceNow. If I'm in quality management, my view of the world might be in Quality Center. If I'm in portfolio management, my view of the world is going to be in something like Planview. And if I'm in dev, my view of the world might be in Jira or Azure DevOps.
But there's only one view of the truth, and we constantly have to translate that in order to get our story straight. And that's done through manual handoffs, spreadsheets, bridge calls and team meetings. We all have a value stream, but how often is it actually designed or architected the way we architect our products? Not too often. I often see tool fights break out because developers want ops to use Jira, and ops wants developers to use ServiceNow, and everybody's bickering about it.
And so the just fabulous metric to use here is flow efficiency to bring some highlight to expose this pain point. So flow efficiency is a measure, it's a ratio. There's the equation. It's work divided by work plus wait times 100%. It's the ratio of how long work is sitting waiting compared to working.
Right? If you're going to measure anything, have a think about measuring wait time, how long work is sitting idle, because it's most of the time. Here we are arguing about how many story points something should be and what a due date should be on something, and what the estimate should be, when the problem is the lack of flow that's going through the system and how things are just hanging out, waiting on people until they have availability.
Anybody want to take a guess at the average flow efficiency for most large enterprises? How many think it's 10%? Lower. Or less. Yes. Yeah.
So the thing about flow efficiency is that you're going to need to understand when work is in a work state and when work is in a wait state. So you're going to have to sort of find some way to flag that in your system. This is one way to do it. There's other ways to do it, but have waiting states or-- And so in here we've got investigate work and then investigate done. So the work in investigate done is waiting until developers have capacity to pull that work in. So you have these queues set up, and you can see how long the queues get.
So it's fairly easy to game a metric. And we know we're human, we will game metrics because we're going to value how we're being measured. And tell me how you're going to measure me and I'll tell you how I'm going to behave. And if you're going to measure me in a logical fashion, then don't be surprised if I behave in an illogical manner. Eli Goldratt, I think, authored that.
I'm going to save a few time for questions. So I'm just going to kind of wrap this up with takeaways and benefits for you to keep in mind that with flow metrics, the goal really is to tie it to the business value so you can have good conversation with your senior leadership. If you go into your CFO's office and start talking about story points, you're probably going to get-- Like I'd probably get kicked out of my CFO's office. But if you can go in and talk about how long things took, or that we didn't get a feature done last month, or that our biggest customer expected it a week before they got it, those are useful conversations that will help drive improvement.
Flow metrics are based on outcomes, not output. So any metric that's measuring an activity, it's an activity metric. Some might call that a, not a proxy metric. What? Proxy metric. I'll think of it probably five minutes after this... A vanity metric, right? It's interesting the number of deployments that got done today, but what does the business do with that decision? How does it help them increase revenue or drive their business value? Okay.
And then flow metrics, that's what we're really trying to do, is provide this feedback loop so we can help improve business decisions. So here's a review of the metrics. All five of these are detailed quite nicely in Mik Kersten's book Project to Product. And flow load and flow time and flow efficiency are also in my book Making Work Visible. And I have flow load too, but I didn't call it flow load back then.
So how do you get started with flow metrics? You got to start somewhere, and the guidance here is just start capturing one artifact, one work item type, maybe it's features, in one value stream, right, and just one flow metric. And because everybody grumbles about time and how long things take, flow time can be a good place to start. But it all depends on your context. Maybe you want to start with flow distribution to make sure that teams have our allocated capacity to do some technical debt work.
Final considerations. If you can have a nice balanced set of metrics that will help you have conversations about how much should we optimize this metric? When is it good enough? When should we start focusing on optimizing another metric to make sure they keep in balance? What do we look for to see what the impact is on other metrics? And improvement takes time. Can take a lot of time sometimes. So what's your baseline? How do we know when we're starting to improve?
So if you send me an email-- That's it. That's my talk. If you send me an email to dominica@sendyourslides.com, I'll send you links to many of my past talks that have most of this information in it and a link to workshops that I do and a bunch of other goodies, excerpts of my book.
Yes, I did bring more "No, Less WIP" stickers with me today. If you want some, there's a whole bunch at the Tasktop booth, so check that out. If you want to follow up on any of these conversations on flow metrics, I'm going to be hosting a Lean Coffee this afternoon in Riverview, same place as yesterday, and they'll start at 3:30 today. So thank you for your time, and we'll see you soon.