Las Vegas 2019
DevOps Transformation - Metrics That Show Business Value
Transforming a 40-year old company from Waterfall to Agile, implementing DevOps, and committing to CI/CD is, to say the least, a journey. Along that journey, baselining, collecting and analyzing valid metrics is key to identifying bottlenecks in the value stream so adjustments can be made quickly and continuously.
In this session, you?ll learn how a company increased time spent on innovation, reduced escaped defects and improved MTTR and importantly, how measuring KPIs proved that Agile and DevOps really do provide a business advantage.
DK
David Kennedy
Solutions Architect, Compuware
DR
David Rizzo
Vice President of Product Engineering, Compuware
Chapters
Full transcript
The complete talk, organized by section.
David Kennedy
David Kennedy: Good afternoon, everyone. Welcome. Thank you all for sticking around and coming to this late-day session. We're glad to have you here. I am David Kennedy, a solutions architect for Compuware.
David Rizzo
David Rizzo: And I'm David Rizzo, vice president of product engineering for Compuware, and we're excited to be able to share with you a little bit about where Compuware has been over the last four or five years. If any of you were here two years ago, or actually it would've been in San Francisco two years ago, there was a session there that I did to talk about our journey, and we're going to give the extension of that, what we've done with DevOps. And today we're specifically going to show you how we measure DevOps, how we use real data to show what we're doing with DevOps and how our engineering organization works. And we're going to tempt the gods of live demo, and we're going to show you some live demo as well. So we'll see how that all goes. We'll keep a good thought. Roll the dice, right? If that goes well, maybe we'll go downstairs.
David Kennedy
David Kennedy: All right, so Compuware is a mainframe software vendor. Who has a mainframe? Awesome. All right. That's great. So we are a mainframe software vendor. We provide developer productivity tools and operations productivity tools to help developers and people in operations develop on mainframes. We've been doing that for over 45 years and we had the opportunity five years ago, we became a private company. A lot of you, hopefully you were in the opening session this morning. Our CEO and CFO gave you a little bit about what we've done. We're going to go through a little bit from the engineering perspective, share with you what we've done, how we've got here. Some of it may be a little bit of a repeat, but we'll make sure you know who we are. So as we think about Compuware and look where we were, the first thing we did about five years ago is we sat back and had to look at ourselves in the mirror and identify a problem. The problem we had is we were a 40-year-old company at that point. We hadn't delivered a new product in a long time. We had been stagnant. We were just kind of a company floating along, deciding what we wanted to do or trying to find our way. And we identified the problem that we weren't being innovative, we weren't being aggressive, and we made a decision that we needed to change ourselves. So what we did is said, we need to move forward. We need to find a way to get better. So we did implement Agile, we started working on DevOps, and we did that by burning the boats. So to win, you must burn the boats, and we did that. We transformed our company in a very short period of time. One morning we woke up and said, "We're going to implement all of this." Within 60 days we had it all implemented, and we haven't looked back since in being a full Agile DevOps company. And we deliver new software updates to our existing technology, new partnerships, new products, and we've done several acquisitions. We do all of that every 90 days. So the first business day of every quarter, we deliver faithfully to our customers. And so looking back at what we did and thinking about it, a great quote from Mark Twain, "Continuous improvement is better than delayed perfection." Especially for those of us in the mainframe market, we want to be perfect. We know we run the world, so to speak. The world depends on us to be perfect, but sometimes you have to make sure that you're moving fast enough to keep up with the world and not worrying about perfection. Our goal is always to continuously improve, so we work hard to do that every day. And how we do that is look at ourselves as we did, and we continue to do that today. And how we really have to look at things, when we look back five years ago and we say, "Okay, we went Agile, we started developing faster. We started delivering every 90 days. We've brought out new technology. We've done all these things." But the reality is, when we ask ourselves, we all say we're doing a great job. How do we know it? How does anyone know what they're doing? They have to have real data, real metrics to look at and say, "Hey, this is what we're doing. This is how we've progressed," or, "This is how we haven't progressed." The ups and downs. No journey... You've heard a lot of stories here this week. You hear a lot of people talking about transformation moving forward. None of that is without some ups and downs. There's some good days and some bad days. If everything's always going up to the right, you have to question yourself. You try and do that, but you have to have real numbers. You'll hear a lot of people in the different organizations talk about how you do it. Surveys are nice to send out to see what people are thinking, and we send surveys out. We do Gallup surveys, we do different surveys for our organization to see how we think we're doing. And what we've done over the last couple of years is we've actually created an entire product, and that's our terminology because we deliver products, our zAdvisor products, which is a product that measures how we're doing with our DevOps, and we use it internally. We have created within Compuware value streams for how we deliver our different types of work. We classify our work in four different types. The standard types of work being enhancements, defects, bugs. We do currency work to keep up with what we're doing and keep up with the market. So we look at those types of work, and we have value streams for each one of those. And for each one of those value streams, we have KPIs that we've created to say, how do things move through our value stream? How do we measure all of that? So that's something that we've worked on and we've come up with what we feel is some very good dashboards. We look at them at the end of every quarter. We actually do a review of how we've done. We use the numbers to say, how have we done this quarter? And always looking to be continuously better. One thing you won't see in ours right now, and don't know if you ever will, but we don't show necessarily a trend. We do at times, but we look at how are we doing today and how can we be better tomorrow. Continuous improvement. All right, so three of the main KPIs that really focus on as an organization is innovation, mean time to resolution, and velocity. And what you see here is our current state, the quarter now, and the trailing seven quarters. And what we're looking for from an innovation perspective is consistency and making sure that we're constantly focusing on delivering value to our customers by releasing new enhancements. So everything that's not a bug, we're considering that as innovation, but also focusing on those external bugs, those defects that reach the shores of our customer, and we have a careful balance of those two. But here, consistent 70% to 80%, we're always working on new enhancements that are going out to our customers. Mean time to resolution. How many days are our customers waiting from the time that they report defect until we actually deliver that back to them? And you can see that is decreasing. And like David just said, we have good days and we have bad days, but we have a constant measurement that we focus on. And from a velocity perspective, how much are we closing from a work perspective in Jira quarter over quarter? And because we have this data and because we have a consistent model within our zAdvisor product, we can start to forecast, and you can kind of see those in the parentheses at the bottom. You can start to see expectations. We can use these numbers, we can use these metrics to determine how much work we can do in the future and use those as business drivers. So, during the conference so far, what you've seen is a lot around value streams and flow metrics. Flow velocity is a key piece to understanding what's going on in our organization from a work perspective. But everyone has to have a consistent definition. If you go to anyone in our organization and you ask them what flow velocity is, and this is the definition you'll get back. Everyone has a common understanding of how we measure flow through our system. But it's the absolute count of each type of work that's been closed in the period of time that we're evaluating. And David's going to talk about how we use this.
David Rizzo
David Rizzo: So, we look at our flow velocity, how much is going through. We can break this down. We do it at an organizational level, team level, and we look at two different things that we've accomplished during a time period. So if we look at a quarter or a year, and you see a couple of numbers up there, there's a total, and then there's two numbers. One of those, if you can read the fine print, says, "Requires development." Those are actual issues where we did work and we actually delivered something out to our customers. So it went through our whole value stream. We updated our software, and we delivered value to our end user. The other number is the number of issues that didn't actually result in us delivering something out of the value stream, which for us is delivering code changes in our product. So, that is work that is done potentially looking at what we might want to do as a new enhancement, potentially just answering some questions for people that are using the products. But it's developers' time and work that's being done that doesn't ultimately deliver what we consider to be value, which is updates to our software. It's not all bad, but it's all things that potentially could be done elsewhere. The goal is when you have your value stream, get as much of the capacity within the value stream delivering value out of the other side.
David Kennedy
David Kennedy: The next item we're going to talk about is mean time to resolution. Again, the amount of time or the average time elapsed from when a customer tells us about an external defect or report an external defect until it's gone through the entire engineering cycle, and we've released that back to them. So if we were going to work on something today, if we were going to receive a bug today, it's going to take about 66 days to get that back to our customers. But why this is so important, David? So MTTR, and David mentioned external bugs, and in Compuware's terms, external bug is, that's a bug that an end user of our software has reported to us. It's the worst thing that we can deliver or do, is to have our customers experience an issue. So this is a key metric for us to look at. How long does it take us to get something back to our customers, to get them back up and running or not experience that same problem?
David Rizzo
David Rizzo: Now we get a little bit more complex, and this is flow time. So when we do decide to work on an item, how long does it take, but broken down by each of the stages that that work item is going to flow through? And we've broken it down into individual cycle times. And these are the ones that we measure today, and we're continuously looking at measuring other segments of work. But backlog cycle time, the amount of time that it sits on the backlog before engineering puts it in progress. Code cycle time, when the developer puts that work item in progress and it's hands-on-keyboard time, the time that they're actively working on providing value back to the customer. Code review cycle time, the amount of time once the developer feels that they're done, that it gets reviewed by a peer developer and everything's been validated. And validation time, the amount of time after that state until it's actually closed and released the customer. And so we roll that up to a total development cycle time, accumulation of all those stages, and then total flow time, the time that a customer can actually download that fix and deploy it to their development or production environments. So this view, Dave, why is it so important to you?
David Kennedy
David Kennedy: Well, this is very important to understand how things move through our stages and how long it takes us, again, to actually deliver value. One of the numbers that's up there is our little iceberg that shows 79 in the middle. And that's the number of days where it can sit and wait in some stage. When a developer finishes coding, it has to wait for another developer to look at it to do a code review. So that's waiting. And as much as we reduce that wait time, that means that the quicker we get something out. And so we get to look at this and say, how long does it take us to actually, from the day we start looking at something, that we get a request to deliver something till we actually deliver it, how long does that take us? And in this context, this is our focuses on our new development, the new things that we're delivering. The fact that we're on a 90-day cadence where we deliver every 90 days, we expect these numbers to be somewhere in that neighborhood. And that's one of the key factors. When we look at all of these numbers, there's some business knowledge that has to come into it. Just the numbers themselves don't mean a lot unless you know and put it in context of your business and what you're looking to do. For us, 90 days is about as fast as our customers can consume, sometimes faster than they can consume new technology and updates, but that's what we've decided our cadence to be. So when we look at that, see can we meet that cadence, and that's what it means to us to see how long it takes us to do something and how much we can shrink that time. If we wanted to deliver sooner, what would that mean? Where can we take time out of the system? Where can we increase our value to our customers ultimately in the
Q&A
Q&A: end? Quick question. Is this the whole organization or it's a specific sample? This, for us, is an example of the whole organization, would be at the organizational level.
David Rizzo
David Rizzo: Okay. All right, so the last one here is innovation, and I alluded to it a little bit earlier. But it's the time spent working on non-customer defects. So this is stories, tasks, enhancements, currency, technical debt, everything that isn't an external defect, as David alluded to. And so we really focused on this number, but we can't focus on it too much. If this gets too high, as you can see there on the left part of that graph, we focus too much on new work, and then it started to drift off, and we're focusing a lot more time on defects. So we really have to be able to see this in time series data and really develop a consistent measurement and really focus the teams on making sure that we're working on the right stuff. And then that's a careful balance and relationship that we have from an engineering perspective with product management, making sure that we're working on new stuff, but we're also taking care of the customers and what they already have and what they're already using.
David Kennedy
David Kennedy: Right. And that is when we talk about that innovation percentage, innovation is when we are ultimately delivering new value. Unfortunately, all of us who write software, we write bugs, and we have to fix it. And how we can minimize that amount of time that we spend fixing bugs and reduce the number of bugs we have, ultimately, that's the goal. And we've done a lot of that, and we'll show a little bit of that, too. But as we go, what can you do with automation? What can you do with testing, automated testing? How can you reduce those bugs that ultimately go out? Because that innovation percent is the higher you get that, that's the more value you're ultimately delivering to the organization. And something that goes back to what they talked about this morning, Chris and Joe, when we talk about customer satisfaction, customers are satisfied when the software works for them and where they're getting new features, new functionality that helps them be more productive. That's when we get the highest customer satisfaction. So driving that customer satisfaction ties directly to this innovation, and that's when we look at our numbers. We can look at customer satisfaction, and then we talk about employee engagement. Developers are happiest when they're writing new code. They love to write code. They love to create new things, and that's when they are fully engaged and want to do something. No one likes to fix bugs. We all have to, but no one necessarily likes it. So by making it easier to get more quality into the software, by adding automation, you get that innovation up. That helps employee satisfaction, and that also helps customer satisfaction, and as was said, that then leads right into cash flow.
David Rizzo
David Rizzo: All right, so I'm going to switch over to a live demonstration. So we really focused on showing each of the individual components. Flow velocity, mean time to resolution, flow time, and flow cycles. And this is the view that we give all of our development managers and our product managers, the ability to look at each of those, but then look at their business specifically from a work type, an agile team, the product line or line of business they're responsible for, or the family of products if they're responsible for more than one. We have a product called Topaz. This is an Eclipse-based IDE, and this is what a developer that receives our software, a mainframe developer, has access to, and that's the entry point into all of our other products. So this is the main thing that we focus on at Compuware and in delivering a great experience to the mainframe developer. And so from this line of business and the family of products that surround that, we can see flow velocity, mean time to resolution, and the cycle times, whether it's new work or a bug, a defect that's reported, and how long that takes to go from when it's reported or when we decide to do that new work until we deliver that to the customer. And we also show on this dashboard, we show on the right side, flow distribution, and that signifies the four types of work. So we categorize all of our work into four types, as I said, and that shows what balance you're doing of all four. You have to give time to all four or something's going to get out of balance. And it's not an even weight, but you have to look at that. So this gives a development team, a Scrum team, the opportunity to look and say, "How are we balancing our resources? How are we balancing our time?" Because we actually use time that they work on. So you're actually seeing our actual time spent working on things. So that's what we show there, and you get one look at how you're doing. All right, so this is a little bit different view into the data model within zAdvisor. And looking from a value stream perspective, if you decide that you want to focus on a key specific piece of the value stream, where do you start? Where do you experiment? Where can you find the bottlenecks within the organization? So what we're viewing here is really a social graph of the communication that's happening within Jira. And so what we can quickly highlight and see are the queues in the system. And a queue by definition is waste. So looking at all the different components that are connected to this queue and being able to identify and start to drill down into where that work is going and the communication channels between each of those nodes. What's unique about this too, though, is what's most important is the people within the organization, the engineers that are contributing to the work that's happening. So this is the relationship between a queue, the products that people work on, but how those people interact with those products. So you could start to see and identify those bottlenecks, but when it's in this form and I decide that I really want to focus on what's the impact of a certain item, I could start to remove items and start to see its effect on the organization or the products and how work is flowing through the system and decide what can't I lose, what's important, so I can start to prioritize bottlenecks if I am able to identify them. The lines aren't visible. I'm sorry. Yeah, it's just that video. Yeah, it's a little bit washed out. So, there are lines that are connecting all of these nodes, and between each of those nodes, it's actually showing the weight of the relationship and the strength of the relationship between each of those nodes. So we can start to see how much is flowing between each of those nodes and the strength of that social relationship.
Q&A
Q&A: Excuse me. What tool did you use to produce this? Great question. So the zAdvisor product is actually built on the Elastic Stack. And so what we're actually using here is the graph technology that comes native with Elastic. But a lot of the work that we've put into this is really around the data model and how the data flows into that system. The Elastic Stack allows us to visualize the decisions and how we built that data model. So it's a custom by yourself? There's a group of individuals within Compuware that actively develop this every day. Is it open source? No, it is not. Sorry. It's something that we should consider. I agree.
David Rizzo
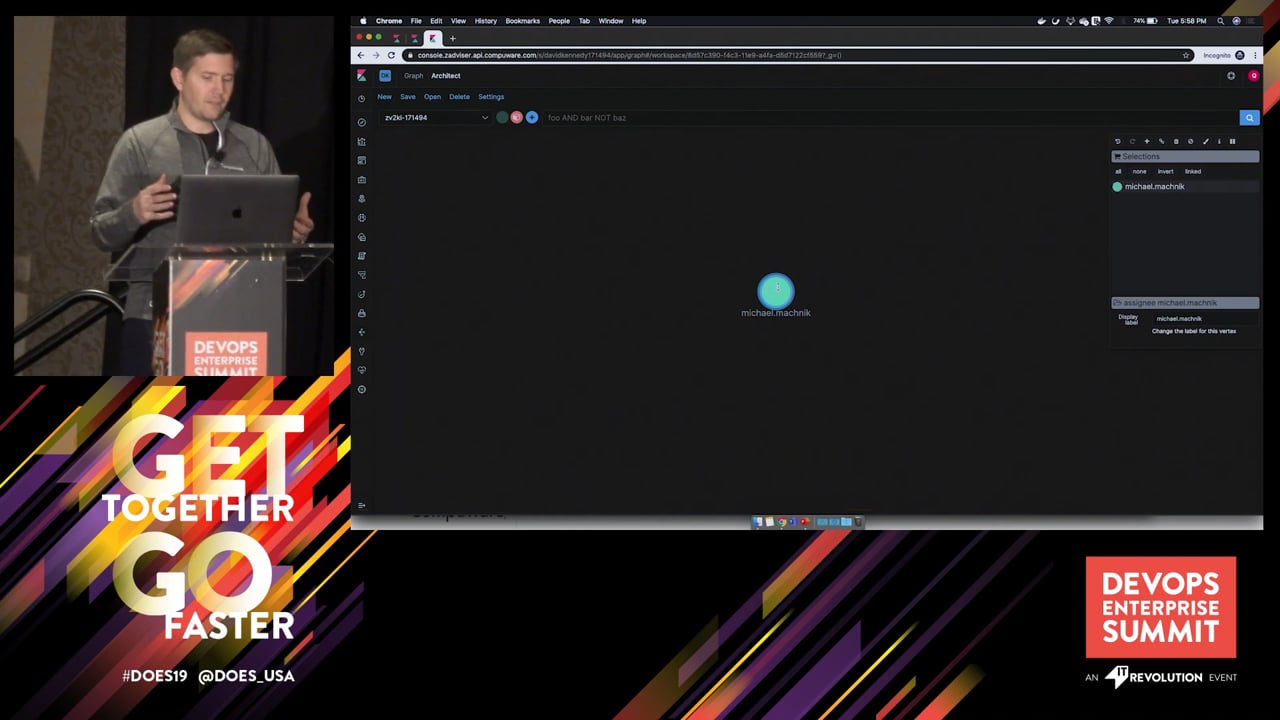
David Rizzo: So one last quick demonstration here. So, Michael Magnet, he's an architect within our organization, and he's a peer of mine. And I want to see or I want to discover Michael's blast radius, I like to call, in the organization. What products does he have an impact on, and the strength of relationship between the products that he's helping influence in the organization? So if I hit the plus sign here, what it's going to do is actually pull in all the products that this architect, Michael, has had an influence on. And what you can see by the strength of the line here, the width of the line, likely what he has had the most impact on. But also you have to consider, is that potentially a bottleneck? Is too much information flowing between one person and one product? It's a neat thing here that we can also do is see and start to expand and look at beyond that product. Who are the individuals that Michael is likely working with on that product? So you could see here is myself, the UX engineer, the product managers, who actually are sitting in the crowd here, and the data science team that helps build the data model behind this. So if you want to see how many people, or what's the impact and the social graph of an application in respect to the value stream, if you've identified an area that is slow and not moving fast enough, you can start to experiment and understand how information and work is flowing through your organization. And this is a pretty powerful graph, and pretty powerful capability within... the product that we have.
David Kennedy
David Kennedy: But to be able to look at your organization and see what happens if you move people. We're always planning. As managers and in organizations, we're looking to say, "I need to create a new product. I need to do a new application. I need extra people over here, and I'm going to take them from here." And a lot of times it's, "I have a problem here. Let's go put out the fire. Let's grab somebody." With the capability there, you can actually remove a person from a product or just take them out completely and say, "If I take this person and put them on a special project, what falls apart? What isn't connected? What isn't necessarily being used?" And that's a very powerful capability that I know when the first time I saw this, I was very excited to see it because we know our Brents in the world from using the Phoenix Project analogy. We know our bottlenecks, and we know some of those key people. Sometimes we don't know who they are. Sometimes we don't realize that the quiet person sitting in the corner is doing a whole lot of things for different areas. And what happens if you move them? What happens to your organization, and how does it stay together or not stay together? So it's pretty cool what you can do with analytics. And it came up with what zAdvisor is built on and the Elastic Stack. And we talked about, you may have missed it, we use Jira, so all of our issues are put in Jira. We do all of our agile tracking. All of our boards are in Jira. This data is coming from tools that are out there and just being put together, and the brains behind getting all those analytics and getting those key KPIs. When you look at measuring how you're doing, that's what you want to look at. All right, next one. Oh, this is me.
David Rizzo
David Rizzo: Yeah. We were doing pretty good. So, as we see in all the speakers and all the sessions, it's what's the problem that remains? One of the key things is data, data, and more data. How we have been able to gain so much value and from a Compuware perspective, we showed you data from a small period of time. We've been using Jira, and we've been tracking things for over 10 years. And we weren't actually tracking the way we track, but we were using Jira, and we realized that we could pull all that data in and analyze it in many different ways. So we had the benefit of data. And that's how you get accurate measurements. That's how you can look at are things changing over time? Are you getting better, or are you getting worse? And so having more data is key. And metrics, standard KPIs to measure DevOps. We hear a lot about metrics. We hear a lot about KPIs. How do you measure that in a standard way? And that for us as a community, to make sure we're all measuring it the same way. I know there was a session earlier that was done by Tasktop. They talk about their metrics, very similar. We're getting very close. There's a lot of things there, but it's key that we get that all together, and we say what is important for us to measure and make sure that we can show our CFOs, show our leaders that we are doing well and it is helping. And again, it's always about sharing in this community and all of us providing information to each other. A lot of organizations, and I know we work with a lot of very large organizations, a lot of organizations find this data, they're concerned about showing it. We showed you live data, that's Compuware. We had good quarters and bad quarters, and we shouldn't be afraid to show what it is because it gives us perspective on everybody has good times, everybody has some failures. There's things, the adjustments that you go on. We have 30 minutes to do this. I could give you a two-hour presentation on the adjustments and the tweaks that we made, where we added automated testing, where we changed how developers work, how we realigned the organization. All of those things that go into it. That's the sharing amongst all of us that gives us real value and really helps us to be able to move forward. As we all look at moving our journeys along, getting DevOps implemented in our organizations, delivering more value to our businesses, these are the types of things that will help you. So I encourage everyone to share your data, share your information. Don't be afraid of it. You will learn something. As we've done with many of the companies that we work with, we've shared our data, they've shared their data. We look at it. We learn things from each other. We continually get better by looking at what we have. So continue to share, don't be afraid, and it will all help you in the long run to move you along your journey. All right, so now for some exciting giveaways. So one of the things I talked about was we do value streams, and we did a whole value stream exercise. And actually, last week we had Gary Gruver. Who's heard of Gary Gruver? Ah, a few people. Okay, good. So we had Gary Gruver actually come in to our organization last week. He spent a couple of days at Compuware, and he looked at our value streams, and we walked through. And we actually presented to him what we present to each other to get a third-party feedback for somebody to give us some valuable input. He has a recent book, "Engineering the Digital Transformation," just came out not too long ago. It's a great read. It's got a lot of good information in it. For all of us who do this kind of thing, it's very informative. And I asked him if I could give a few away because it was so valuable to me in helping with our value streams. So the first three people that go to garygruver.com and download the book and use Rizzo, that's me, he picked my... for the code, you'll get a free e-book. So please take advantage of that. Also, if you're not one of the first three, you can still download it there. I don't get paid for it, but it is a good... In the essence of sharing, it is a very good book. It provides some insights into value streams and different things. And like I said, we spent two days with him. It was a great couple days. So, that's Gary. And the last thing, we'll take any questions. We are out of time. We just hit the zero marker. We'll take any questions. We will be here afterwards to answer any questions. We have a booth in the trade show. You can stop by and see us. We'll be here through tomorrow. You can always reach out to us at Twitter, email. Happy to answer any questions, give you more information about it.