Las Vegas 2019
DevOps Transformation - Metrics That Show Business Value
Transforming a 40-year old company from Waterfall to Agile, implementing DevOps, and committing to CI/CD is, to say the least, a journey. Along that journey, baselining, collecting and analyzing valid metrics is key to identifying bottlenecks in the value stream so adjustments can be made quickly and continuously.
In this session, you?ll learn how a company increased time spent on innovation, reduced escaped defects and improved MTTR and importantly, how measuring KPIs proved that Agile and DevOps really do provide a business advantage.
DK
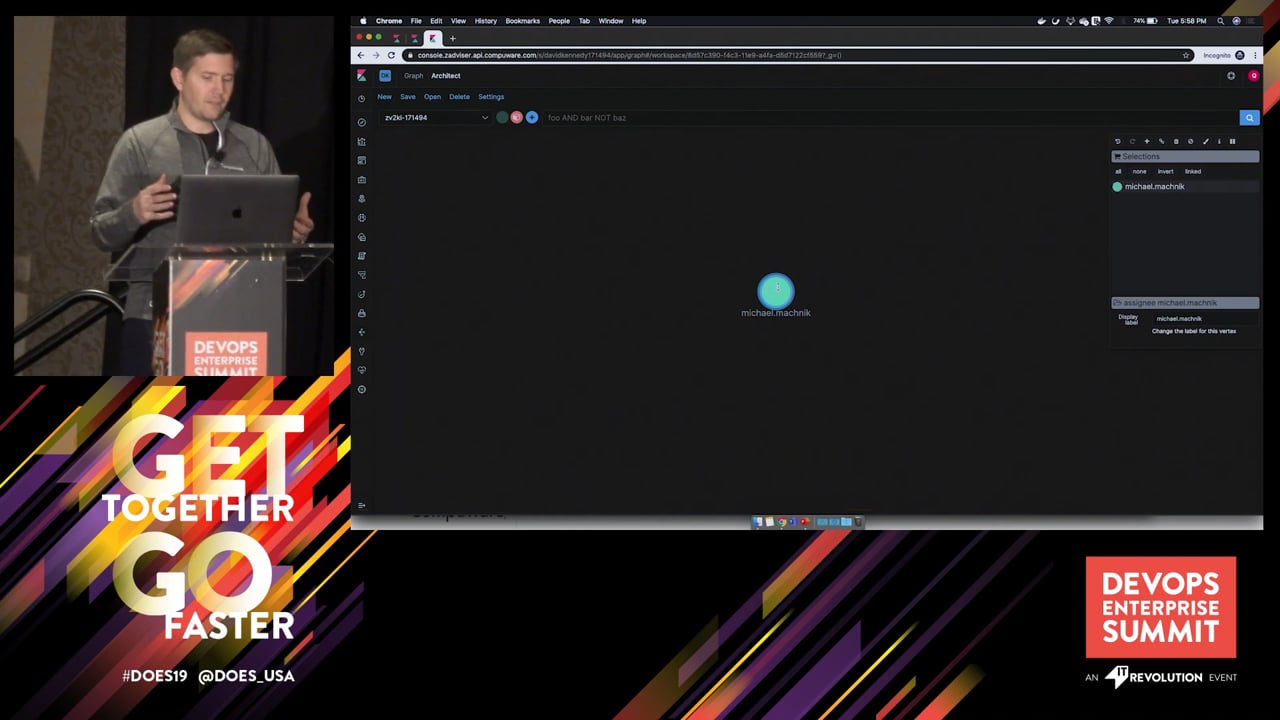
David Kennedy
Solutions Architect, Compuware
DR
David Rizzo
Vice President of Product Engineering, Compuware