Las Vegas 2020

Kubernetes Attacks: What is Your Cluster Trying to Tell You?

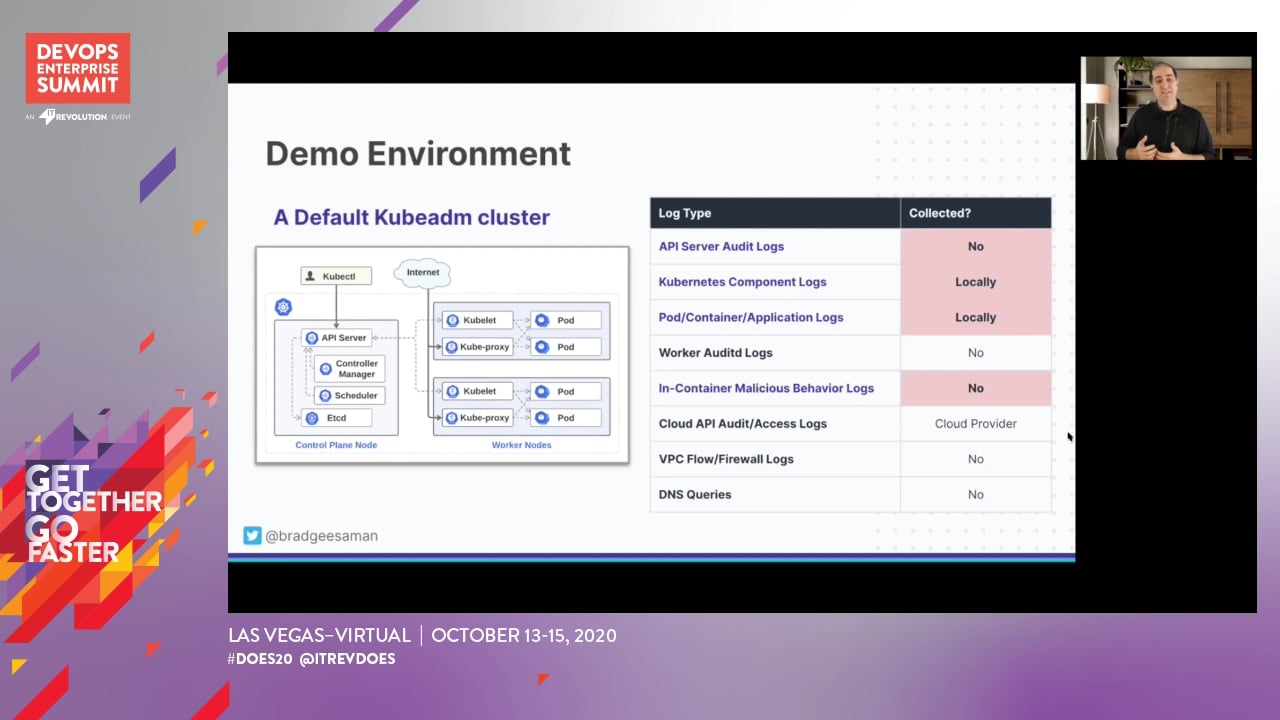
If an attacker got inside your cluster, would you know about it? Kubernetes has become the defacto standard for container orchestration, bringing with it a new set of security challenges. One of the biggest problems we see, among DevOps and Security teams alike, is a lack of knowing what to look for when it comes to malicious activity.


In this session, you’ll learn how to detect and respond to threats at runtime. We’ll share practical strategies for pinpointing malicious activity, and you’ll be armed with the knowledge and confidence to not delay efforts to secure your Kubernetes and container environment. We’ll also look at examples for how many enterprises are already reducing risk with a secure DevOps approach.


This session is presented by Sysdig.

BG

Brad Geesaman

Co-founder and Chief Security Architect, Darkbit

PS

Pawan Shankar

Product Marketing Director, Sysdig

Transcript

00:00:12

Hello, everyone. Welcome to Kubernetes attacks what your cluster is trying to tell you.

00:00:18

And my name is and I'm responsible for product marketing here at excited to be here with you, Brad.

00:00:26

Likewise, and I'm Brad co-founder of dark bit, and we're here to talk about ways to improve security detection in your Kubernetes clusters, without breaking the bank organizations that have adopted a DevOps culture, tend to follow a repeatable pattern for shipping software. First, they get it working. Then they deploy through some form of automation, ops teams then implement just enough operational monitoring, and then there's pressure to rinse and repeat after gaining confidence with this pattern. That's typically when some security measures get introduced, for example, code security and vulnerability scans just before new deployments in the pipeline. This can often add unwanted friction. When additional security checkpoints are added, this often increases friction and slows overall velocity. The delicate nuanced balance of risk reduction versus feature velocity tends to consume a lot of resources from all of the teams involved. This leaves very little time for focusing on follow on security activities.

00:01:26

And as we've seen firsthand, many organizations have underdeveloped container security detection and response capabilities. So for this talk malicious activity detection means that when a security incident happens inside the cluster, that activity is captured. All the activities are essentially exported to another location and the activities are then filtered to form high confidence indicators. And the teams are notified with supporting context. Why is this capability so uncommon? Well, there's a couple of contributing factors. Number one, defaults have inertia. Kubernetes defaults are unlikely to be sufficient in terms of supporting security detection needs. When the default configurations are baked into production, the risk and costs of changing them later is much higher. Dev ops and infrastructure teams are typically busy shipping and keeping things running operationally. And that's where they're incentivized security teams often lack sufficient expertise about containerized environments and common attack scenarios in them. There's actually an education gap.

00:02:29

Finally, there's a perception of low risk due to infrequency of security issues that said most clusters, lacks, sufficient defense and depth measures that would prevent even a rare security incident from causing serious damage. Security of the environment is a shared responsibility. And if dev ops and infrastructure teams are focused on shipping and security teams, don't have the understanding of what to look for. And there's no pressing security event forcing this focus. We ended up with a gap in that middle ground that attackers can take advantage. So how might attackers take advantage of that gap and responsibility while it's not an exhaustive list? Here are four common attack scenarios that Kubernetes operators should be aware of first, a publicly available API server with misconfigured permissions or even a vulnerability. They're actually bots that scan for this every day. Exploitable flaws in libraries or applications such as Apache struts or custom code vulnerability in your actual application code, third leak developer or administrative credentials.

00:03:32

This is AWS keys, SSH keys, API keys pushed into public code repositories, or even just plain old phishing attacks against those developer laptops. And lastly, via vulnerable or malicious codependency in the supply chain, getting baked into the image. This could be a node NPM module, a Python PIP module, go module, a Ruby gem, et cetera. We're going to focus on supply chain compromise. There are two common ways to bypass the trust and containerized software supply chains. First, you create a dependency and get other packages to use it. And those then get baked into an image. And second, you just create a malicious image and entice others to run it. So we asked if a malicious container image is run inside of a Kubernetes cluster. What first few steps might a knowledgeable attacker take and critically would we even know about it? So we created a default Kubernetes cluster for our first demo environment, as it turns out, not much is available to us for detection without additional effort, the API audit logs, which are activities of access and changes to Kubernetes resources who made them, and when actually requires additional configuration to enable the Kubernetes component logs logs from the processes that make up Kubernetes itself, the API server, the kubelet cube proxy at CV, et cetera.

00:04:54

Those are actually logged to local files on the nodes and logs from containerized workloads are logged locally to files on the nodes, but they're also not shipped anywhere off the cluster by default and Kubernetes doesn't have any in container malicious behavior logs. That's just not part of what its responsibilities are. So essentially we lack key kinds of visibility unless we SSH into the nodes and specifically look for items or take additional measures to collect those logs. You may have heard about automated attacks that mine Bitcoins is the desired goal of the attacker, but let's be a little bit more creative. Let's run a container image with a malicious dependency via deployment manifest. When the developer deploys that container in the cluster that's step one, the malicious image is pulled from their public registry. It's a step two, we'll run them a snippet of malicious code that's step three and just just enough code to fetch and then run a shell script from my attacker controlled web server.

00:05:52

That's step four. And finally in step five, the actual payload it'll download some tools inside the container attempt to enumerate permissions against the Kubernetes API server. And then if it can create a separate malicious workload that runs on all worker nodes, if that succeeds, that workload will upload all of the secrets from all of the Kubernetes worker nodes to that same attacker web server. Now there's a couple of assumptions. The container image has publicly available an outbound access from the cluster to the internet is allowed, which is the default and the permissions for the default service account allow the creation of other pods. So let's see that in action.

00:06:34

So the attacker has slipped the malicious code snippet into a code dependency. So let's take a look at that. And as you can see at the top here where it's commented out, it's obvious skated in the bottom, but at the top, we're just pulling in a script from a web server and turning it into a shell script, making it executable and executing it. And that gets baked into a Docker container. So let's look at the Docker file that makes that Docker container. And right here in this line where we add the contents of that app folder into the container, that's where it gets baked in. And we've created this malicious container called Brad Eastman Ruby app with the tag V 1 2 3. So when this container runs, it downloads and runs a shell script. So let's look at that shell script here. First, we're going to install curl. If we can using a package manager using curl, we're going to attempt to download kook control the binary inside the container. We're going to use coop control to list secrets, or try to connect to the API server to list secrets.

00:07:50

Next we're going to enumerate some permissions. So in the list off, we're going to ask the API server, what permissions do we have? And we're going to send them back to our attacking web server. And lastly, if we have the ability to create a pod, we're going to attempt to run a Daemon set again, pulling that Damon set from the attacking web server. So if that criminal container has Kubernetes API access, it runs that steep secret stealing Damon set. So let's look at that manifest, and this is what would be pulled down in that script. Okay. So what it's doing here is a loop and it's mounting the host file system. And it's looking for all the Kubernetes secrets that are attached to the worker nodes. Again, this is one run against all of the nodes in the cluster. So on our attacking web server, we're going to be looking at the web access logs. So I'll start that tail now. And if we're a developer and we're interacting with this default cluster, this is what this cluster will look like. It's a very basic cube ADM cluster with one node. And it has some, some of the basic pods in here. There's no real workloads just yet. So now with the we're the developer, and we're going to deploy the Ruby app that we talked about that has this malicious dependency baked in. And as you can see, it's very straightforward, nothing, nothing malicious, uh, on the surface.

00:09:19

So when they deploy that manifest with a code control apply, it seems like nothing happened, right? But let's go back over to the attacking web server. And we can see that it asked for the shell script, we posted the results of did it have access, and then it went and grabbed the Damon set manifest and applied it. And all of these posts you see here are from the pods running in that Damon set, sending all the secrets back to the attacking web server. So in less than 10 seconds, all of the secrets have been exfiltrated, there's no API audit logs. There's no malicious activity, detection logs, no network logs by default in cloud environments. Really, we have no visibility. We can summarize what just happened in a more general way using the MITRE attack framework terminology. In other words, shared language that your defenders will likely understand this demo mimics the following realistic attack techniques.

00:10:15

Number one, we got a shell inside the container. We launched the package manager and the container that was to install curl. We contacted the Kubernetes API server from the container multiple times to enumerate permissions, to, uh, start the privileged statement set, which brings us into the next step. We started the privileged container, that privileged container then searched for keys and passwords and launched a suspicious network tool to send those back to our attacking web server. So if we want to see all of this activity, should we just get all the logs possible? Charity majors of honeycomb IO answers to that pretty succinctly? The answer is no, not everything. It's a great way to spend a lot of money and drown and busy work, and it doesn't actually improve your detection. Methodical approach is needed that balances the detection capability with timing costs. So with that methodical approach, it's important to focus on the right areas.

00:11:09

David Bianco published his pyramid of pain in 2013 and a great blog post. And it describes how to build detections that are more painful for the attackers to bypass. So instead of chasing millions of MD five hash as the binaries and IP addresses things that attackers can easily bypass or sidestep, we focus on the tactics and techniques at the top of the pyramid that described the attacker behaviors. In other words, we're focusing on detections with high signal and low noise because high quality detections become higher quality events, which become higher quality alerts. Let's look at the available Kubernetes security logs through this new lens. A few have high signal, but to stand out is also having low noise and a reasonable specifically the API server audit logs and in container malicious behavior logs. If we look back at our four tax scenarios, we can see several places where attackers may share common behaviors, and we can look at how well those behaviors are covered by just these two log sources.

00:12:10

So when purple, we can see that the API server audit logs can tell us who or what interacts with the API server and those types of actions relating to permissions enumeration and getting all the Kubernetes secrets. They really stand out and in teal, we can see activities happening inside containers, themselves conclusive when data is accessed exfiltrated or leaked. And when workloads would extra privileges to the nodes are run and certain types of attacker tool usage. So if we resort this list, we can see which of these log types can provide a high degree of security value without requiring a large investment of time and energy. Let's enable these two log streams in a new demonstration cluster and see what this visibility affords us. Now, we created a default Google Kubernetes engine or GKE cluster for this demo. We've enabled a few specific logs and we shipped them to a central location, specifically the API server audit logs, the Kubernetes component logs and containerized workload logs. We've also installed Falco and open source container security detection suite donated to the CNCF by cystic. And that's going to alert when malicious activity happens inside a containerized workload, all of these logs are all shipped off the cluster to the cloud providers, logging system. We've then used some light filtering to pick these logs out of the stream and drop them into a single location for consolidated viewing. So we don't have to SSH into any virtual machines.

00:13:37

So the new cluster has Falco installed and fluid bit to ships the logs centrally, and here we can see what the Q control get pods. There's a few more things going on here, but basically the Falco namespace at the very top shows that the Falco Damon's set is installed on this one node cluster. And the fluent bit Damon set is installed shipping all of those logs. So if we refer back to that same manifest this Ruby app dot emo, again, it's the same thing no changes made. And if that developer deploys that manifest into this new GKE cluster,

00:14:18

Again, there's nothing obvious that just happened, uh, to the developer. However, we can see all the secrets are being sent and posted from this cluster. There they go. So they're all there that just happened. However, tailing, the, the raw logs from the Falco Damon set shows us a lot has just happened. Falco has picked up on a number of things, but this isn't really easy to look at, right? Let's go look at it where it looks a lot easier to parse. Okay. So over here, these are the filters that I talked about. We're just picking out a couple key things. All of the Falco alerts, the listing of secrets that fail, uh, creation of privileged statement sets and some of the permissions enumeration. And this ends up into this log stream here where we can see the package management adding curl. We could see the moving of coop control into the binary directory.

00:15:19

We can see the getting of secrets and right here where I've highlighted. You can see that the seat, the API server audit logs have showed. There's a permission denied on the list. Secrets. A couple of instances where the coop control binary is used to connect to the API server and run inside the container. We could see the enumeration of permissions from this default service account. Again, another access to the API server. You could say, we could see where the ask was. Can we create a pod specifically? We could see where those come from, the coop control running. And lastly, we can see the sensitive Mount container where the privileged Damon's set Ryan and sent all the secrets back to our web server. So if we look at our log viewer of these filtered events, we can now trace each step and know really within a few seconds that this cluster was compromised, which pod to investigate and which malicious actions were taken.

00:16:08

And what Brad has showed is how effective it is to enable a few of these key audit log type environment, such as the Kubernetes audit logs, and also using the in container, uh, malicious activity that you're monitoring for. And both of these servers are great, a great tools in your one-time security toolbox. So now let's dive in into a little bit more detail as to how you can implement a strong runtime security in your environment. The way to get that deep visibility from inside your containers, one approach is to leverage the system calls. Now, this is the agent is deployed on your host and either via an E BPF probe or installing an open-source kernel module. We look inside the carnal and have visibility into all the system calls that are traversing, the carnal, that that could be your host network metrics, other full-stack metrics, custom metrics like Prometheus's and all security events that might be happening in your environment.

00:17:05

All of this data is collected via the system agent, and we store that in our backend. Now, what do we do with that data? So we collect all that granular data and enrich it with the metadata from your cloud and your Kubernetes environments. So whether you're running in Kubernetes or other multicloud environments, we can slice and dice that data that we collect and allow you to see all that deep data from an application and a service lens. So now your development team can not just identify a vulnerability in communities, but map it back to a specific namespace or a service that might be effected. So beyond just vulnerabilities, you can also detach and monitor for changes such as your CPU or other memory changes. And a lot of times, uh, IO changes can be a great indicator of compromise. So being able to map that back to specific services and applications allow you allows you to respond faster to a breach that might be occurring in your environment.

00:18:10

Now, Brad talked a lot about audit logs and it, how it's a great way to get that high signal to noise. Integrating with audit logs via Falco. Insisting is very simple. So you may have users or workloads, uh, writing API calls that gets registered in the Kubernetes audit log events. And then all of these audit logs are automatically ingested by the system agent. And we have out of the box policies that allows you to write detection rules based on events that are happening, uh, and, and registered in the audit log. So some examples could be if someone's store credentials in a config map versus secrets, um, if someone executive into a pod modify a file, you know, where was that connection initiated from, uh, as well as where there's some privilege escalation or permission changes that might be happening in your Kubernetes environments, really understanding who did what in Kubernetes can come from the APS server and that audit log gives you a great audit trail, essentially, of exactly what happened.

00:19:11

All of these events are then sent back to the system platform. Um, and you can also analyze this in full detail and seat and put a lens of your applications, your Kubernetes environments, uh, to really pinpoint exactly what's happening and where it's happening. Finally, what happens when something does go wrong? The question also get teams are asking is, do we have a forensics plan in place? And especially when it comes to containers, containers are ephemeral by nature, which means, you know, a malicious attacker can compromise a container and the container could be long gone or, you know, spun down by Kubernetes. So it really having that audit trail, uh, that gives you the visibility across the user level, all the way down to the events that happen. So what commands, the connections that were made, all of that data, uh, and audit trail is something that your team needs.

00:20:06

And then you can also use tools like system inspect and open-source tool, uh, to really go deep into, uh, the forensics data that, that you, you might be collecting. So very similar to Wireshark where you had a peak cap file. Uh, you can generate an S cap file, which just takes a dump of all the system calls and allows you to recreate all that system activity and really go deep into your incident response workflows, and pinpoint exactly what happened even after that container is long gone. So this allows you to have a robust, instant response and forensics plan in place to respond to events when they do occur, uh, in your environment. So time for a story. So let's see, let's talk through an example, one of one customer that had leveraged the audit log integration and found it extremely useful, uh, when it came to enforcing the right, the strong runtime security in the environment.

00:20:58

And this was a company that was looking to track sensitive modifications that happened inside their cluster. Uh, there were already using open-source tools, uh, loved Falco, and really wanted to be able to leverage and extend that in their environment. So some of the detection rules that came with system security that were out of the box, it really helped them save time and creating some of these rules from scratch and the system security detection engine that was built on, on Falco allowed them to create flexible policies on top of all that, uh, audit log information. And then when, uh, in a potentially a sensitive modification happened, they could understand, was this a malicious event? Was this a routine operation or, and ultimately just having more visibility into exactly what's going on in their cluster and making their detection response workflows much more efficient and much more and much faster, uh, when it came to, um, events that were occurring in the environment.

00:22:00

So we talked a lot about audit logs, runtime security inside your containers. Now what about your cloud? Because that's a lot of times these containers are living in your AWS, Google cloud and other environments. So when it comes to AWS specifically, we're extending this capability, this detection capability to secure, not just your containers, your could be at these clusters, but also your AWS cloud environments. So when we think about cloud trail, it's very similar to how we were talking about audit logs, where a lot of times AWS users and services are performing these API calls across a large number of AWS services. I think there are close to 175 services, and this list continues to grow. So cloud trail becomes a great security tap where all these services are sending their logs out to. Um, and you can collect the logs from, uh, CloudTrail and ingest that into cystic.

00:22:56

And again, similar to how you were writing detection, doco based detection rules on top of the audit logs from communities. Similarly here, you're able to write those detection rules on top of the CloudTrail logs in AWS. And this allows you to attack whether, you know, an S3 bucket, um, has encryption turned off, did someone, you know, launch a load balancer that's public facing or changed some IAM role permissions, all these events, again are logged there. You can write your tension rules to be alerted on it immediately without waiting through a ton of logs, trying to find that needle in the haystack and in the, in the cystic platform, you can apply these policies as well as see all those results in a centralized place, or, or if your preference is to forward them to AWS security hub or other, uh, you can do that as well.

00:23:49

So just to summarize the system's secure DevOps platform really built on an open source foundation, uh, leveraging Falco, uh, our open-source contribution to the CNCF, uh, for meteors, for monitoring and core engine, uh, and the systemic opensource, and the two key products here are cystic secure and cystic monitor. And they're tied together in a single platform because we believe that ultimately, if cloud teams want to ship applications faster, uh, they should embed security and monitoring into their DevOps workflow. Some use cases that we support as customers are adopting, could we add ease and containers in their production environments? So starting off with the essential workflows, we packaged them up in a tier called, called essentials, and that provides five key workflows image, scanning, runtime, security, container, incubatees monitoring, uh, cloud services, monitoring, and compliance. And as teams start to get more mature, they're looking for some of the advanced workflows that are offered in the enterprise tier.

00:24:51

So, uh, native prevention and enforcement via, uh, pod security policies, helping you generate and validate that before you apply them in production machine learning based image profiling, uh, the incident response and the forensic workflows, as well as more troubleshooting and extended compliance coverage that are offered there as well. Finally, we're really integrated into your cloud native stack. So starting from the build phase, we integrate directly into your CI CD pipelines or your registry, so we can scan your images, um, where they are. And we extend this further by offering an in-line scanning approach, which allows you to scan locally on the same node on your registry, uh, without sending images outside of your environment. And this is a more secure approach because you're not sharing your sensitive data or your registry credentials to a third party vendor. All the scanning happens locally. And the only thing that's sent back that says dig are, is the metadata about the scan results, runtime security, again, built around Falco, and also more monitoring capabilities by extending for permitees, and then responding to respond standpoint, really plugging into the tools that your developers love such as PagerDuty slack service now, as well as forwarding it to forwarding events, to tools like Splunk, syslog IBM QRadar, uh, really having a strong response framework, uh, that, that is aligned with the tools that you're already using.

00:26:17

And then the platform, again, can be deployed self hosted in your own environment, or offered as a SAS service for many dev ops teams. This is a very critical because their teams are small and there's not a lot of people that can maintain, uh, the product. So having a SAS service that relieves them of that and allows them to focus on solving the core security use cases that the product provides. So, uh, you know, just to kind of sum it back up here, uh, what Brad talked about was a lot of reasons for why it's difficult to detect malicious activity. Uh, and one of a couple of the ways that you can solve for that is really collecting that valuable security logs, uh, via the audit logs in behavior, uh, activity that's happening using Falco, uh, and really allows your dev ops and security teams to understand exactly what's happening in your environment.

00:27:10

Uh, and we also talked about how the system platform can extend the capabilities of the audit logs using Falco, uh, with more workflows and processes around that, that allows you to have a better handle between the security and the dev ops team, and ultimately apply that shared responsibility model that I talked about earlier, uh, inside your container environments, um, by shining that light on any malicious activity that's happening, um, at runtime. And if you're interested in, you know, this was useful and you're interested in more resources, uh, we have a list here, but definitely check, check those out. Um, and you can learn more about, um, all of these topics in more detail. And if there are any more questions, uh, jump into the private slack channel for the ask us anything session, um, it's at expo assisting, uh, we'd love to engage in more conversation and answer any questions that you guys might have. Thank you so much. Appreciate the time.