London 2020
Project to Product: Lessons From a Year of Data Driven Flow Diagnostics
Over the past year, Dr. Kersten and his research team have been collecting exhaustive value stream data sets from enterprise IT organizations undergoing digital transformation.
They have used the Flow Metrics defined in the Project to Product book to trace the path that hundreds of thousands of software artifacts take from inception to running software. As they sliced and diced that data to correlate flow metrics to business results, some fascinating diagnostics emerged.
In this talk, Dr. Kersten will summarize those learnings, and show the correlation of each to one of the Five Ideals from The Unicorn Project. From minor maladies to major pathologies, each of the flow diagnostics offers powerful lessons that help us understand the biggest bottlenecks to achieving DevOps at scale.
DM
Dr. Mik Kersten
Founder and CEO, Tasktop
Chapters
Full transcript
The complete talk, organized by section.
Dr. Mik Kersten
Hello, everyone. It's great to be speaking with all of you today from Vancouver, Canada. I love the DevOps Enterprise Summit community and the London event because of how it's constantly advancing the state of the practice in DevOps, Agile, and in the end, how software is built. So instead of doing the typical Project to Product talk, today I'm going to tell you my last 12 months of lessons learned from collecting all of the different flow data that we've measured across many organizations' value streams. I've collected some of the most interesting stories.
I'm going to tell you how they actually help highlight some of the five ideals that we've learned from The Unicorn Project, and we'll show you some of these flow diagnostics. I've never seen data of this kind before, where it's live, real data from large organizations, not just open source projects, not just smaller product value streams, but true enterprise end-to-end data. So I really hope that this dataset helps us all advance the state of the art on how software is built and how we can help organizations transform and scale. Now, to really understand data and software at scale, we need to go to where the work is being done. In production, we go to the factory floor.
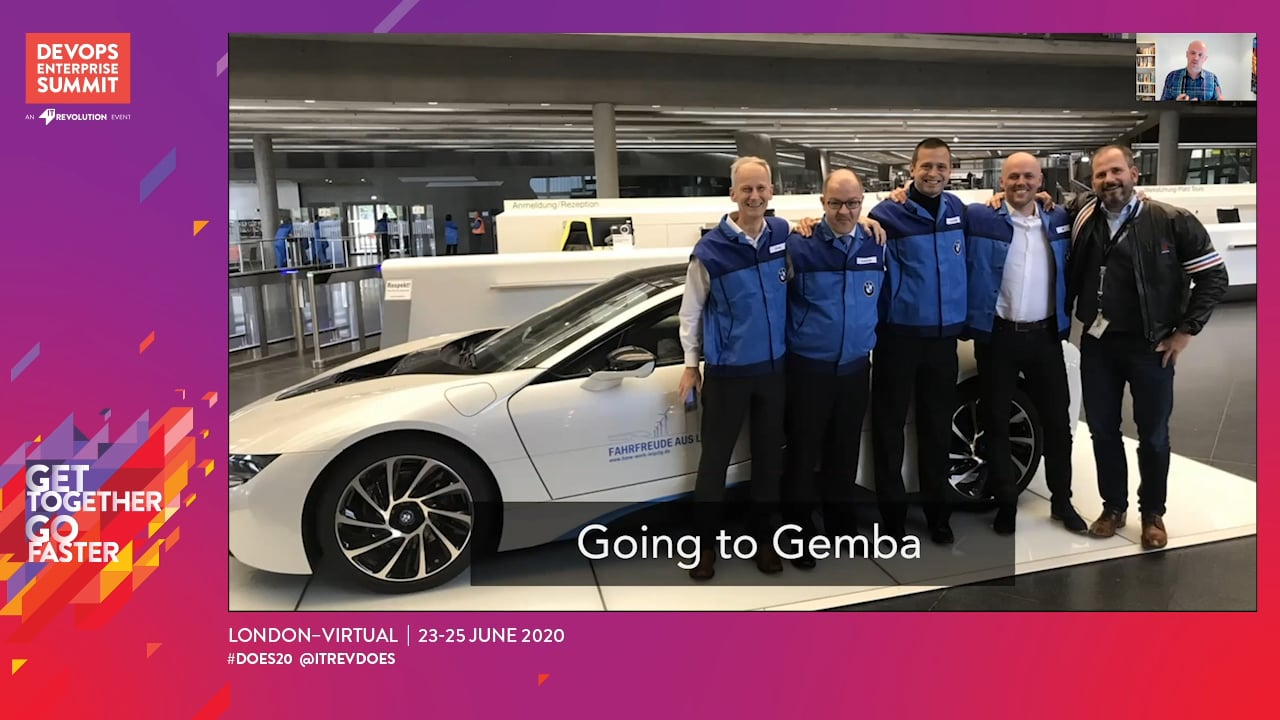
So this is what's called Gemba, the actual place where work happens. This is something that Taiichi Ohno said, it was key for executives to take a portion of each week to learn where production happens, how production happens, where waste could be found, and to really understand what's going on on the production line, to focus on learning. And it's really directed at executives, so the people who are making decisions about how production happens, because of course, the people on the floor itself, they tended to know what was wrong. They had things down the line, such as the Andon cord, and it became a key part of lean management. So what I really want to understand is how going to Gemba actually manifests itself.
I did that through a two-day trip of going to Gemba at the BMW Leipzig plant. So this is me and my colleagues there, and Teve Strater is one of the characters in the Project to Product book. And we had this two-day, not just 45-minute like Taiichi Ohno recommended, but this full two-day Gemba walk. And it was fascinating. I learned amazing things about production, around how you connect business to delivery through these amazing advanced production lines.
But there's also something that struck me as very different. This is something that Donald Reinertsen's pointed out, and it's a problem of not being able to see and observe directly what happens in parts of production. Now, with cars, it's fairly straightforward. So to understand quality problems, we just need to look at the rework portion of the production line. To understand where bottlenecks are, we actually see where production slows down, or we have the largest error rates, things like high complexity of wiring harnesses.
But the challenge is that once we shift to intangibles, once we are no longer producing cars or physical objects, it gets much more difficult to see what production's like. And Gemba walks are all about seeing flow across value streams. So we no longer understand, unless we have a way of observing the production of intangibles, and software is not tangible. It's not something that we can touch. We're not understanding how that flow happens.
The big challenge with that, of course, is, and this is something that Daniel Kahneman talked about in "Thinking, Fast and Slow," is that what you see is all there is, is a common fallacy that leaders have, but that actually everybody has. So we assume that what we see is sufficient, and if we're only seeing things like org charts, if we're only seeing things like budgets and cost centers, then that's how we're making decisions on how software should be built. Now, this is very different to what technologists see when they're building software, because for technologists, those intangibles are very real. They're the code that we touch. They're the infrastructure that we're constantly managing and improving and debugging.
So I noticed that there was this very large disconnect between what reality was, what executives saw on the software side, and what practitioners actually saw, and that we need to connect these two worlds. So the question really becomes is, how does Gemba work for intangibles, for building software, for building software, digital, and data assets in our organizations? Is it sufficient that we do management by walking around, and executives have conversations with different staff who are working on different parts of the software portfolio? Are meetings sufficient where you review the software that's being built? Is it sufficient to have a big room planning and all those kinds of ceremonies that we've put into Agile frameworks to effectively connect the way that we do planning and conversations around business strategy to the software that's being built?
So personally, having experienced all those things, worked with countless organizations to see how they implemented them, how they did their things like big room planning or PI planning or implementing A3s to connect business to software, I realized that these things really weren't sufficient. That the further that you were from the code, the further that you were from the actual work. So the closer you got to the code, the closer that you understood the flows that were actually happening, the problems that were there, the distractions and the issues and the architectural issues that developers were constantly struggling with, or that others were constantly struggling with. So the question for me became: how can we actually get this information into the right state to understand and for people to see? How can we have the right kind of Gemba walk, given that conversations simply aren't enough when you're talking about software at very large scale?
And really for me, this journey produced the Flow Framework. The goal of the Flow Framework was to have a way of inspecting, and you see at the bottom layer of the Flow Framework there, inspecting the work that was actually happening. Because this magical thing happens with software, which is that we use very advanced tools, and the work happening in the tools actually represents the work that's going on. So if we could somehow, at the right level, inspect those tools, then we could maybe get some kind of better view that would make sense both to the technology side and to executives. And a key part of my PhD thesis about understanding value streams and flow was actually to understand and to create these abstractions on what was flowing through those tools that represented our work as we work on defects and incidents, and improving the software through features and architecture improvements, and so on.
So the question became is how can we make this a better model, this more abstract model of how we work? We know that we need to connect to where the work is happening. That is the whole point of the Gemba, to dig right into that, but that we need to show this at a more abstract level. Because I've seen many executives do things like learning to code classes and such, and it's not quite enough to understand the code because in the end, we need to see the way that code flows, the way that value flows across many value streams, and across very complex value streams. So we somehow needed to create something that was value stream oriented, so that was end-to-end, that allowed proper value streams to be defined, and that will allow us to view the flow of work through those value streams.
And that's exactly the goal of the Flow Framework and the flow metrics is to define those value streams, and then to measure things like flow velocity, flow efficiency, flow time, and flow load. So I won't go into detail on those metrics here, but velocity is how much gets done. Efficiency is the ratio of waiting to active work. Flow time is how quickly work flows from end to end, so all the way from the business and idea strategy to the customer, and then flow load. What's the work in progress?
What are those metrics? The goal is that we do these for the four flow items that provide a more abstract view that both the technology side and that the business side can agree on. So rather than having all of the granularity of things like dozens of work item types and story points for measuring things and so on, we're instead seeing it in just these buckets of features, defects, risks, and debt so we can make these trade-offs. And what's happened over time is that really over the past two years, I'm taking the data here in this presentation from the past year, we've been able to see these dynamics in place. So we've been able to see, for example, how flow velocity might increase when technical debt is reduced.
And so I'm going to tell you stories about these different lessons that we've learned by inspecting these very dynamic software value streams. So, and the goal, of course here, is that where this data is allowing us to see these dynamics and hopefully gives you some insights on how you might apply this to your own organization. Now, some of the inspiration for me here was actually understanding and learning more and working with Gene Kim on the five ideals. Because one of the things that was so amazing to me about The Unicorn Project is just how much of a Gemba walk it is. And as you're reading Maxine's story, you get immersed in it, and you actually get to have that feel of what it's like to be working with code, what it's like to be struggling, what it's like to be following through this path of a ticket, that bottom of the value stream network that you see there, the tool network.
What it's like to be struggling through trying to get work done through this complex and disconnected and dysfunctional value stream. So a fascinating thing that happened as we were analyzing this work is that we noticed the five ideals emerge from the data set. And we actually saw flow stories in these diagnostics I'm about to show you that highlight the existence of the five ideals as we try to improve flow. And so with the first one that we're going to start on is going to be locality and simplicity. So the first ideal in Gene's Unicorn Project.
And the flow diagnostic I'm going to show you to highlight how important this is through real data, was an organization, a financial services organization, who was championing investment in modularity. So they actually understood the value of locality and the fact that you only want to change one place in the code, ideally, or one place in the larger code base to deliver some unit of value. Now, this organization, and I'm showing you some of the charts of their different flow metrics right here. I'll just highlight the key parts that you need to understand. They wanted to deliver more value.
As usual, there was disruption happening, so there's some innovative fintech companies out there, much smaller with much less baggage. And they felt that what you see over here in the green is that their flow distribution for features, so how many features they're able to deliver, as well as their flow velocity for features, was just too low. They needed to deliver more value to the market more quickly to really remain relevant and to really deliver what they wanted to their customers. So now the question becomes what gets in the way of that? And as soon as that's happening, as soon as you have all of those feature backlogs getting too big because the business wants those features, the backlogs grow and grow.
So somehow, they were not able to get enough features done, and what you see here basically is this value stream, the flow load. So the work in progress over here gets so high, there's no way to finish all of this. The work is just queuing up and waiting for longer and longer periods of time. So we've got a really big problem here. We've got a value stream that can't deliver on its business goals.
Now, if we actually then dig into what's happening, if we go deeper into the Gemba, if we go deeper down to the production line, and we actually start looking at things like the user stories and what's blocking the work, a fascinating thing happens. So here's a snapshot of that. It turns out that most work is blocked on core backend services. And you can see over here there's some user story, and you see it coming up all the time that other parts of the software portfolio of the actual product constantly get blocked on core backend services, basically on this monolith. So what's going on here is that there's this lack of locality.
Those parts, we dug into this further, those parts of the portfolio, of course, were replicating all the business logic that core backend services should've been doing. Core backend services was painfully understaffed at this point. And so this lack of investment, because they result in this core backend services monolith, made it very difficult for this organization to compete. So what happened here is the data showed that the monolith had to be slayed. This initiative had been around for two years, by the way, to slay the monolith, but the data was never visible enough, of course it was to the technology side, it was just less visible to the business side, to really heavily invest in this rather than in the customer-facing parts of the product portfolio.
Seeing this data actually emphasized that ideal of how important locality and simplicity is, how important making this piece more modular per that ideal was to making everything move faster. Now, the second ideal and the journey in finding the second ideal of this data was quite interesting. So this one is focus, flow, and joy, and definitely a personal favorite of mine. So let's see how we uncovered this in some of the flow stories that we came across. This is a transportation services company, and we're now looking at the impact, at the flow metrics after the COVID-19 shelter-at-home came into place in the offices in the states where they operate.
So at first, this very interesting thing happened. So, the wait time increased significantly after the shelter-at-home orders. So this was quite disruptive. This is a large organization, a lot of traditional work happening there, but also very committed to transformation and to becoming a software innovator. So they're tracking these things very closely.
Now, what we also see is that in April, this is just this past April, flow efficiency decreases as well. So this shelter at home is really having a significant impact. But a month after those orders to shelter at home were provided, flow load actually starts to begin to decrease. So we're watching this, and for me, a really big part of the Gemba walk experience is to work with multiple organizations to help look at their flow metrics, so I get to see how each of their production lines work. And whenever you see flow load decreasing, there could be something positive happening.
Now, what was actually happening over here is that the backlogs, you can actually see if you look a little bit up, flow velocity went way up. What happened, this was an amazing thing, the teams took this opportunity where there was so much disruption around different aspects of the business. They took this opportunity to basically clear the backlogs, to take all those smaller user stories, all those things that were clogging their backlogs, and actually get them all done. So to stop starting work and to start finishing work. And this to me was just an amazing experience because I saw some of our own teams do this internally at Tasktop, where you take that opportunity to improve things in terms of work getting done, in terms of finishing things.
And, in a very fascinating way, when you allow all those teams to focus, so they were able to take that work off quickly, finish it quickly, without being interrupted, without constant context switching. They got a ton more done, and they actually significantly reduced their backlog. As you can imagine, that's something that was quite a difficult time for the organization, as it was for many, and for all these individuals and all these teams. The joy that actually comes from delivering this much value in this sort of time is very substantial. So that focus that allowed the teams to have a lot more flow at the time that they started working at home, and then delivered so much more for the organization, for the customer, was just a great thing to see.
So the third ideal, improvement of daily work. So this is a healthcare organization, and this healthcare organization it was sort of clear. You can see this in these charts over here. Debt work is purple. So debt work means that we're now working on reducing technical debt.
But what's interesting is just the sheer amount of work in progress as seen in the flow load chart here, was tremendous. And you can see it's trending up. So once again, and this, by the way, in the last year of learnings has been a really common thing, is that we're seeing the flow load on most value streams that we've measured is just too high. And when it's too high, there's a cost to that because if your flow load's too high, it turns out your velocity's actually worse. This might be counterintuitive, but this is something that's been clearly established through the work in product development flow by Don Reinertsen and all the follow-on work from that.
So you even have Dominica DeGrandis, here's one of her time thieves here. The cost of too much WIP is very substantial, as she documented in her book, "Making Work Visible." So the problem with this is they never have a chance to catch up. Again, more demands coming into the value stream, and there is no way to keep up because the velocity is simply not high enough. And so this will, again, be one of these scenarios where things just get worse and worse. So the question is: How do you fix this?
Now, we see that the flow efficiency, and this is why it's so important to take these flow metrics as dynamics that are measuring this complex value stream. So what we see here is that the flow efficiency indicates that a lot of work is started and then stuck in these long wait states. So there's something wrong with this picture because if it's waiting this long and more work is arriving, we're seeing that it's very hard for the development teams to keep up. So of course, our flow hypothesis at this point is, okay, well, maybe we just need more developers here. So the fix to this then is to look at this, how can we reduce this cost of delay?
Because everything is queuing up. And the bottom line was, the only way to do that here, and this is a little bit similar to the last story, except it was not observed just yet, is that the work in progress, so the flow load has to be decreased. If the flow load's not decreased, work will delay longer and longer, efficiency will keep going down and down, and that cost of delay of actually delivering this work to customers will get worse and worse and worse. So this basically paved the path for the team, but think of the team as all the teams that comprise the value stream, to work together to reduce the work in progress, and by reducing that work in progress, to actually get more work done at the end of the day, at the end of a sprint, at the end of the release cycle. Now, we're onto the fourth ideal, and the fourth ideal is psychological safety.
And this has been a really interesting one, and I should mention that this, to me, was one of the most sophisticated ones. But as I was actually working with Carmen DeArdo, with Dominica DeGrandis on learning this flow data, and with Naomi Lurie as well, they started talking about this, really came from Dominica, this concept of flow safety. That if teams didn't feel safe in making their work visible, work would not be visible, and again, you would have the wrong assumptions being made by leadership, by executives, and by others. So let me just tell you the story, then get back this notion of how important this notion of psychological safety is in improving and in creating a positive feedback loop. This is a telecommunications organization, and the very interesting thing that's going on here is that when we look at the flow distribution, so how much work is being done on defects, risks, debts, or features, all we're seeing is red.
And red in these charts is defects. So it seems like on this particular product value stream, which is substantial, it's numerous agile teams, it looks like only defects are being delivered. So that seems odd. I'd actually, to this point, never seen a chart that showed only defects. And then we see that the flow load is something very different.
So there's all these backlogs of features, and of course, they're piling up. So what exactly is going on here becomes the question. And what's actually happening is that in this particular case, the teams had not indicated how their feature work is being done. So feature work was being taken into one system where features were being tracked, where roadmaps were being managed, but the delivery teams had not made their feature work visible. So the question becomes is why had they not made their feature work visible?
In one case, what we saw, it was actually a set of contractors who were simply not using the same agile tool that the organization was using. In another case, a set of teams actually said that they didn't want to make that part of their work visible until they were 100% agile. And so these are both very problematic statements because it makes things look much worse to the organization, because it looks like there's nothing being done. So you've got basically people at a higher level in the organization assuming that, okay, there's not enough progress being done here. Something's fundamentally wrong.
Meanwhile, all that's happening is that the teams have not been given the time to actually make their work visible, nor the safety, in one case, to say, "No, you don't have to be 100% agile. We want to help you at an executive level. We want to support your improvement now, today." It was actually that same part of the organization, leadership want to champion investment in tech debt. Meanwhile, of course, there's no feature work or tech debt work visible. So I think the key thing here was this organization realized that they needed to work together to make sure that each of the flow items was visible, that the team was getting credit, not only for the features they were delivering, and so it's multiple teams, actually, but they were also getting credit for the risk work that they were doing, as well as for the tech debt work that they were doing.
And so to do that, you really need to put in place the psychological safety that drives that improvement, that makes work visible across the value stream. And I think one of the key things I've learned is that actually gives developers, testers, the op staff, basically credit for all of this work that they're doing, because again, the value stream's going to be overloaded with work, not vice versa. So once it becomes visible or too high, you've got too much load, you can actually have the right discussions on how to optimize throughput. If the work is not visible, you don't have the safety to do that, you can't have the right kind of discussions for that. Here's another interesting one, and the last, this is the fifth ideal.
So this is the issue of customer focus. So let's take a look at this. This was an interesting one at a health insurance company, which, of course, is also trying to improve their bottlenecks. And so what we're seeing here is tons, of course, of items that have work in progress. So you're probably seeing this trend here.
Overly high flow load seems to be a pretty consistent thing in the industry. But let's dig a little deeper into this. So if we look at where work is actually being done, what's happening is we're seeing there's multiple done states. And this, by the way, in the Azure DevOps and GitHubs and GitLabs and Jiras out there, this is a very common thing in the dev tools, is there are multiple definitions of what is done. So the question is what does done actually mean?
And this has been one really fascinating learning over the course of the past year. So often, when we're measuring value streams, done means it's been implemented, it has not been delivered. So when we looked at these flow metrics, we were like, okay, something's pretty fundamentally wrong here because what's happening is it looks like all this work is being done, but the customer's not getting value. And this is, to me, just one of the many examples of why it's so important to structure your value streams and to structure the entire delivery process around customer focus and customer centricity. If you've called something done when the dev team's done with it, if you've called something done when the security review's done, you're only getting a partial view of the value stream.
And so this will actually manifest itself in all sorts of different ways. We've seen overly high flow efficiencies. It looks like flow is very efficient, but that's because you've got bottlenecks post-code delivery, or you're only measuring when things have been delivered to a staging or a development environment. And again, that's not the customer's perspective. So the key thing we've learned is it's critical to actually measure flow from a customer focus and to measure every value stream, which a value stream's fundamentally about a customer's pull from a customer's focus.
So you then reprocess this data, this was an interesting learning, to change what it means for it to be done to when it's actually deployed, and you get a completely different chart if you think of that flow load chart. What's actually happening and what we see here is that that analysis showed that development is not at all where things are piling up. Development's actually been doing a great job handling that flow load. It's actually been in the lack of deployment automation, and it's actually been in the traditional challenges with DevOps. So it's measuring this at the right level that allows the business as a whole to understand, where do we need to invest?
Are we actually as good at our DevOps automation as we thought we were, or is it only working for a few of our value streams that were more forward-looking, and do we actually need to invest a lot more in DevOps? And that's absolutely one of the trends that we're seeing. And what's fascinating about this is, this has been uncovered just by combining simple flow metrics with the customer centricity of done is not done until that work is delivered. And just because one value stream has gotten very good at their CI/CD pipeline doesn't mean that this is happening cross-organization, and you might actually be just at the very start of your DevOps modernization effort, not at the end. So, the bottom line is that to really find that Gemba, to find what organizations are able to do with advanced manufacturing and do so effectively, this is the iX3 now back in production in China, we need to see things at the right level of granularity, and the Flow Framework is your tool to do that.
So what the Flow Framework allows you to do is to go away from measuring projects and cost centers, to measuring these product value streams and to inspecting them to see how these very complex value streams that have various kinds of trade-offs that you're making between how work is taken in, how it's processed, the tools, the frameworks, the technologies that you're using, and measure them end to end. Measure them with a customer focus, measure to find where you've got bottlenecks in your locality and simplicity and so on. To go away from silos and proxy metrics to flow metrics and business results, to actually connect those flows that you're seeing to how those are driving business results, rather than measuring these subsegments of the value stream and getting that false sense of security, as we just saw in that example, of flow not being measured end to end, but flow only being measured until development is done. And then, of course, of going from this fragmented value stream to an integrated value stream network, the same thing that we've got in an advanced production line, and making sure that we've got that measurable network that has actually baked measurement into it, as we've seen with advanced production. Where whenever you go to the Gemba, in this case, through these more abstract views because we're delivering intangibles, you actually see meaningful information that can help you help the teams deliver, and can help you make the right investment decisions.
So with that, I'll wrap up. If you're interested in the "Project to Product" book, just Google for "Project to Product." It's been published on IT Revolution. To get in touch with me, go to LinkedIn or Twitter, and I'll also be hosting an ask me anything session around this talk, and we'll be very happy to take your questions and share more of the learnings that we've had over the course of the last year of learning how to measure these value streams, learning how to diagnose these flow problems, and then helping others understand these flow problems through the lens of the Flow Framework. So I should also mention the Flow Framework is licensed Creative Commons, so you can reuse it to your heart's content, and all author proceeds go to charitable program. All author proceeds from "Project to Product" go to charitable programs supporting women and minorities in technology.
So with that, thank you. Please stay in touch, stay safe, and I look forward to hearing from everyone.